The complete guide to managing and optimizing your expenses

Author
Josh Pigford
If someone asked you the question: “How much money did you make last month?” most of us would be able to answer correctly with a reasonable degree of certainty. However, if the question was flipped and someone asked you how much money you spent last month , many of us would be left clueless.
A survey taken by Gallop shows that only 33% of Americans prepare a detailed household budget, and those households that have incomes of more than $75,000 are more likely (39%) to prepare budgets than their lower-income counterparts.
Why is tracking your expenses so important?
The easiest road to bankruptcy is by not paying attention to your expenses.
Tracking and understanding your expenses is one of the main pillars of a sound financial plan. By doing this, you can visualize how your income is distributed among various aspects of your life and learn to prioritize your spending towards where it's required most.
This can be as simple as paying off high-interest debt early, allocating income towards investments at the beginning of the month instead of the end as that helps you invest more and spend less on discretionary expenses, and so on. Tracking and optimizing your spending and expenses can help you locate areas of your life in which you are perhaps spending a bit exorbitantly and reallocating that capital towards more productive financial habits like building an emergency fund or investing it into the equity or bond markets.

If you'd like to dive deeper into the topic of optimizing your expenses, tune in to the Ask Maybe podcast episode on this very topic.
What are your major expenses, and how can you reduce + optimize them?
Beware of little expenses. A small leak will sink a great ship.
Benjamin Franklin
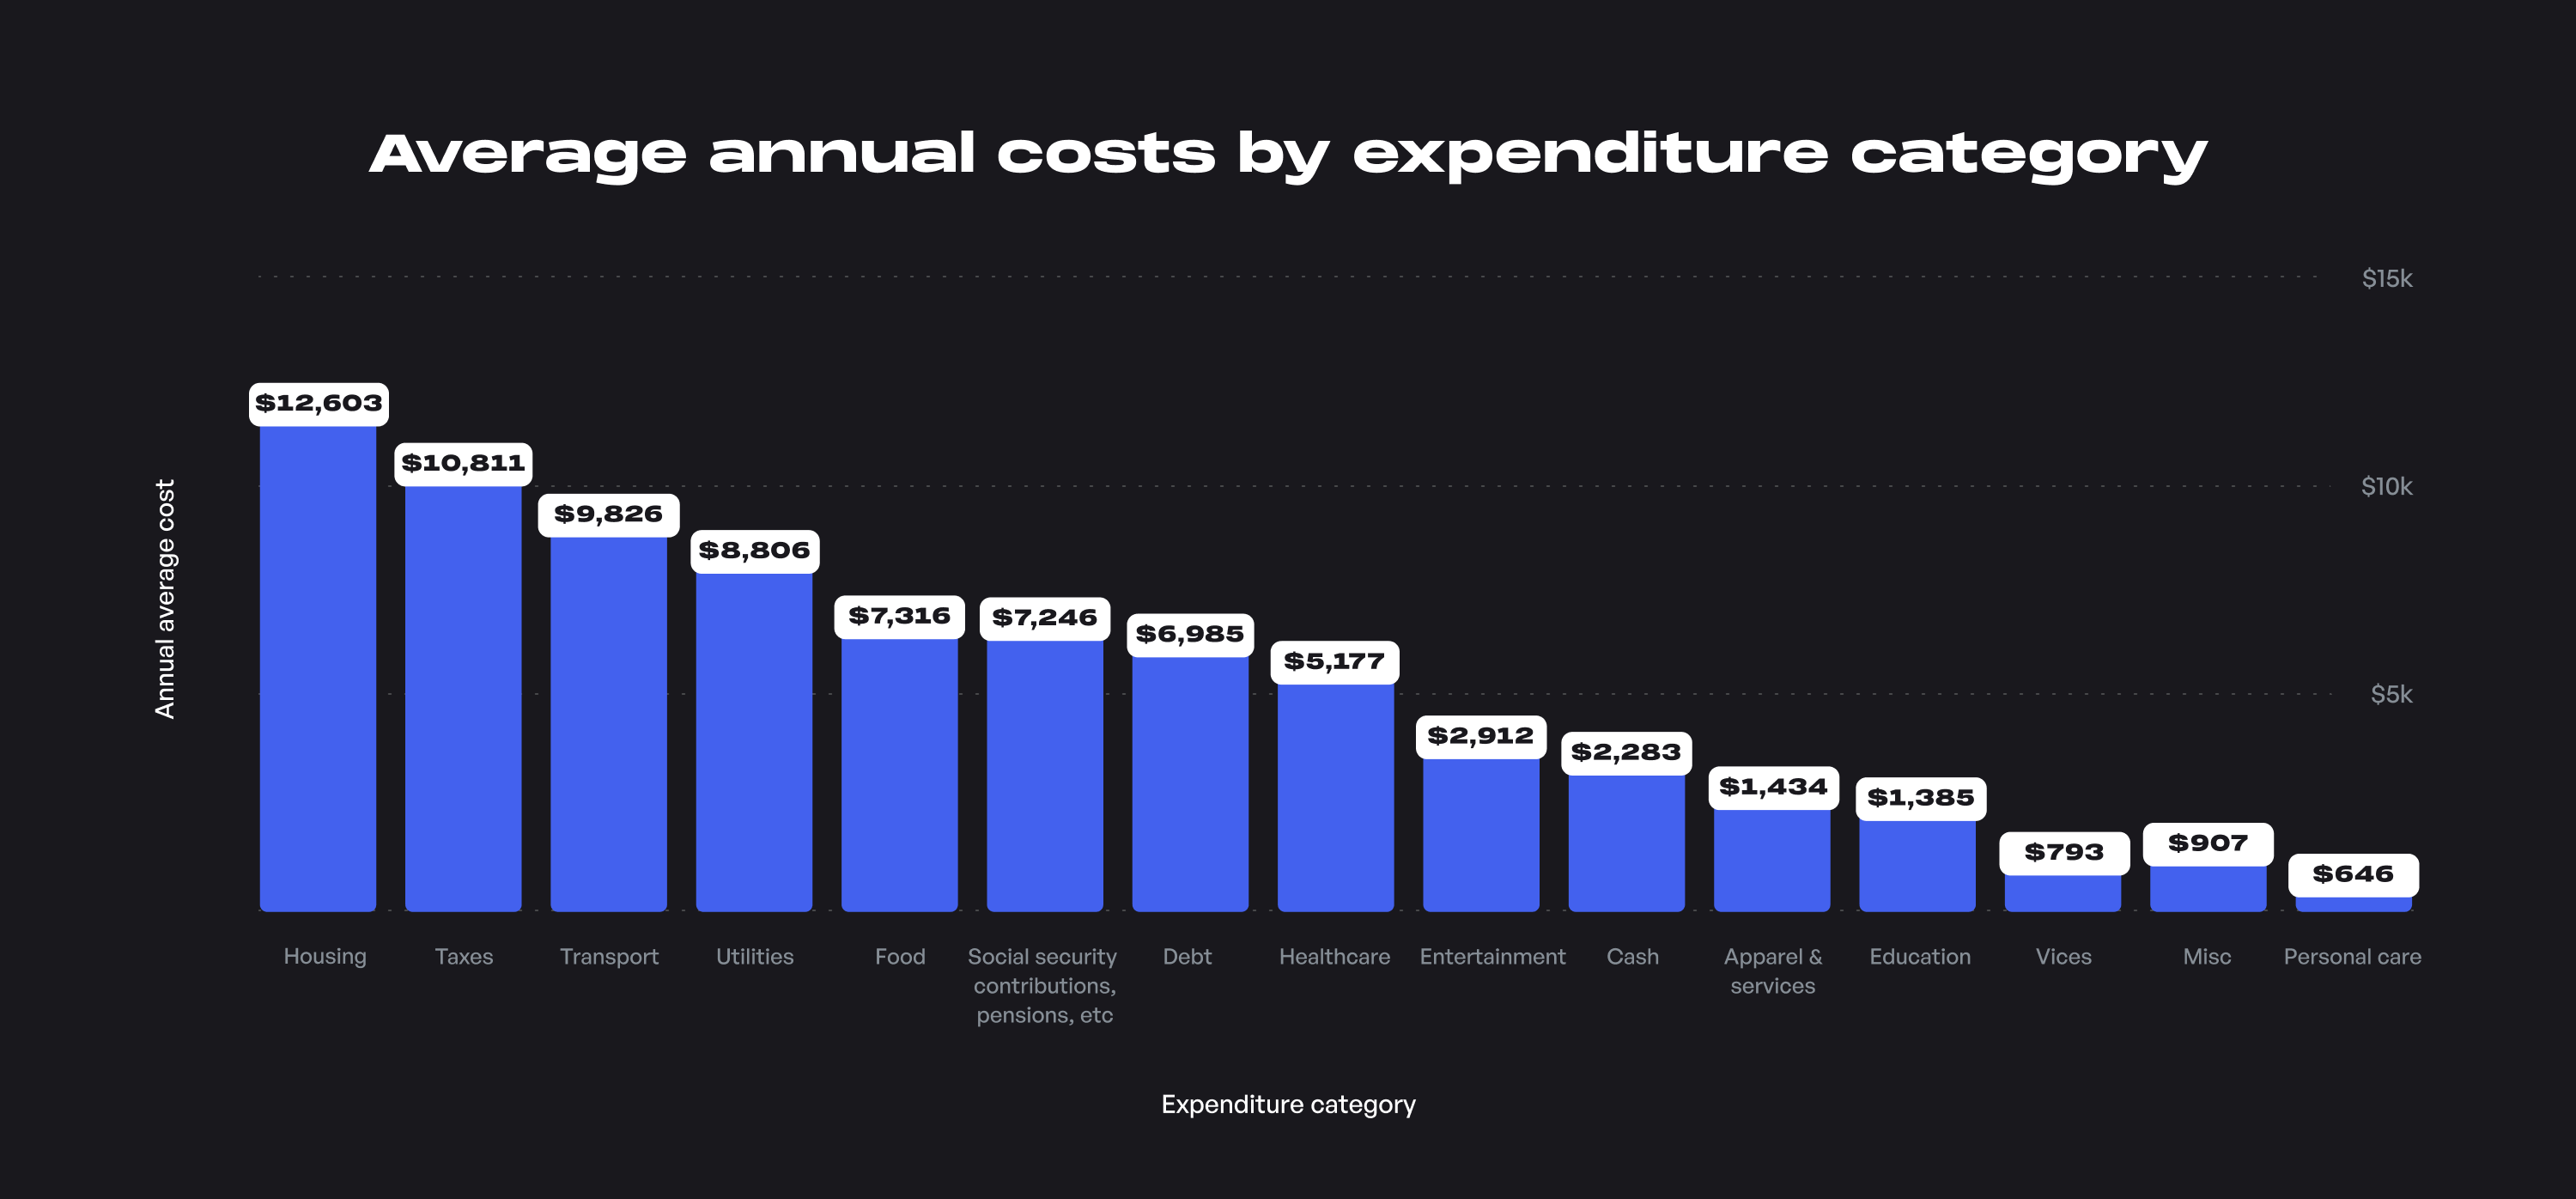
All data in the chart above is based on Consumer Expenditure data from the Bureau of Labor Statistics for 2020. Note that taxes and debt payments + savings data have not been included in the newest report (September 2021), so these figures are based on 2018 data.
Let's take a look into each of these categories and see how we can optimize spending, thereby reducing expenses and improving the rate of savings. Your spending might be tilted towards other expenses, namely, childcare, college tuition, and healthcare depending on your life circumstances.
So, based on your situation, it would be preferable to focus on optimizing spending and expenses in those categories that you spend the highest percentage of your income on.
Housing
The average U.S. household spends approximately $21,409 per year on housing.
Direct rent and mortgage payments
This expenditure component includes rent, mortgage, housing insurance, and property taxes.
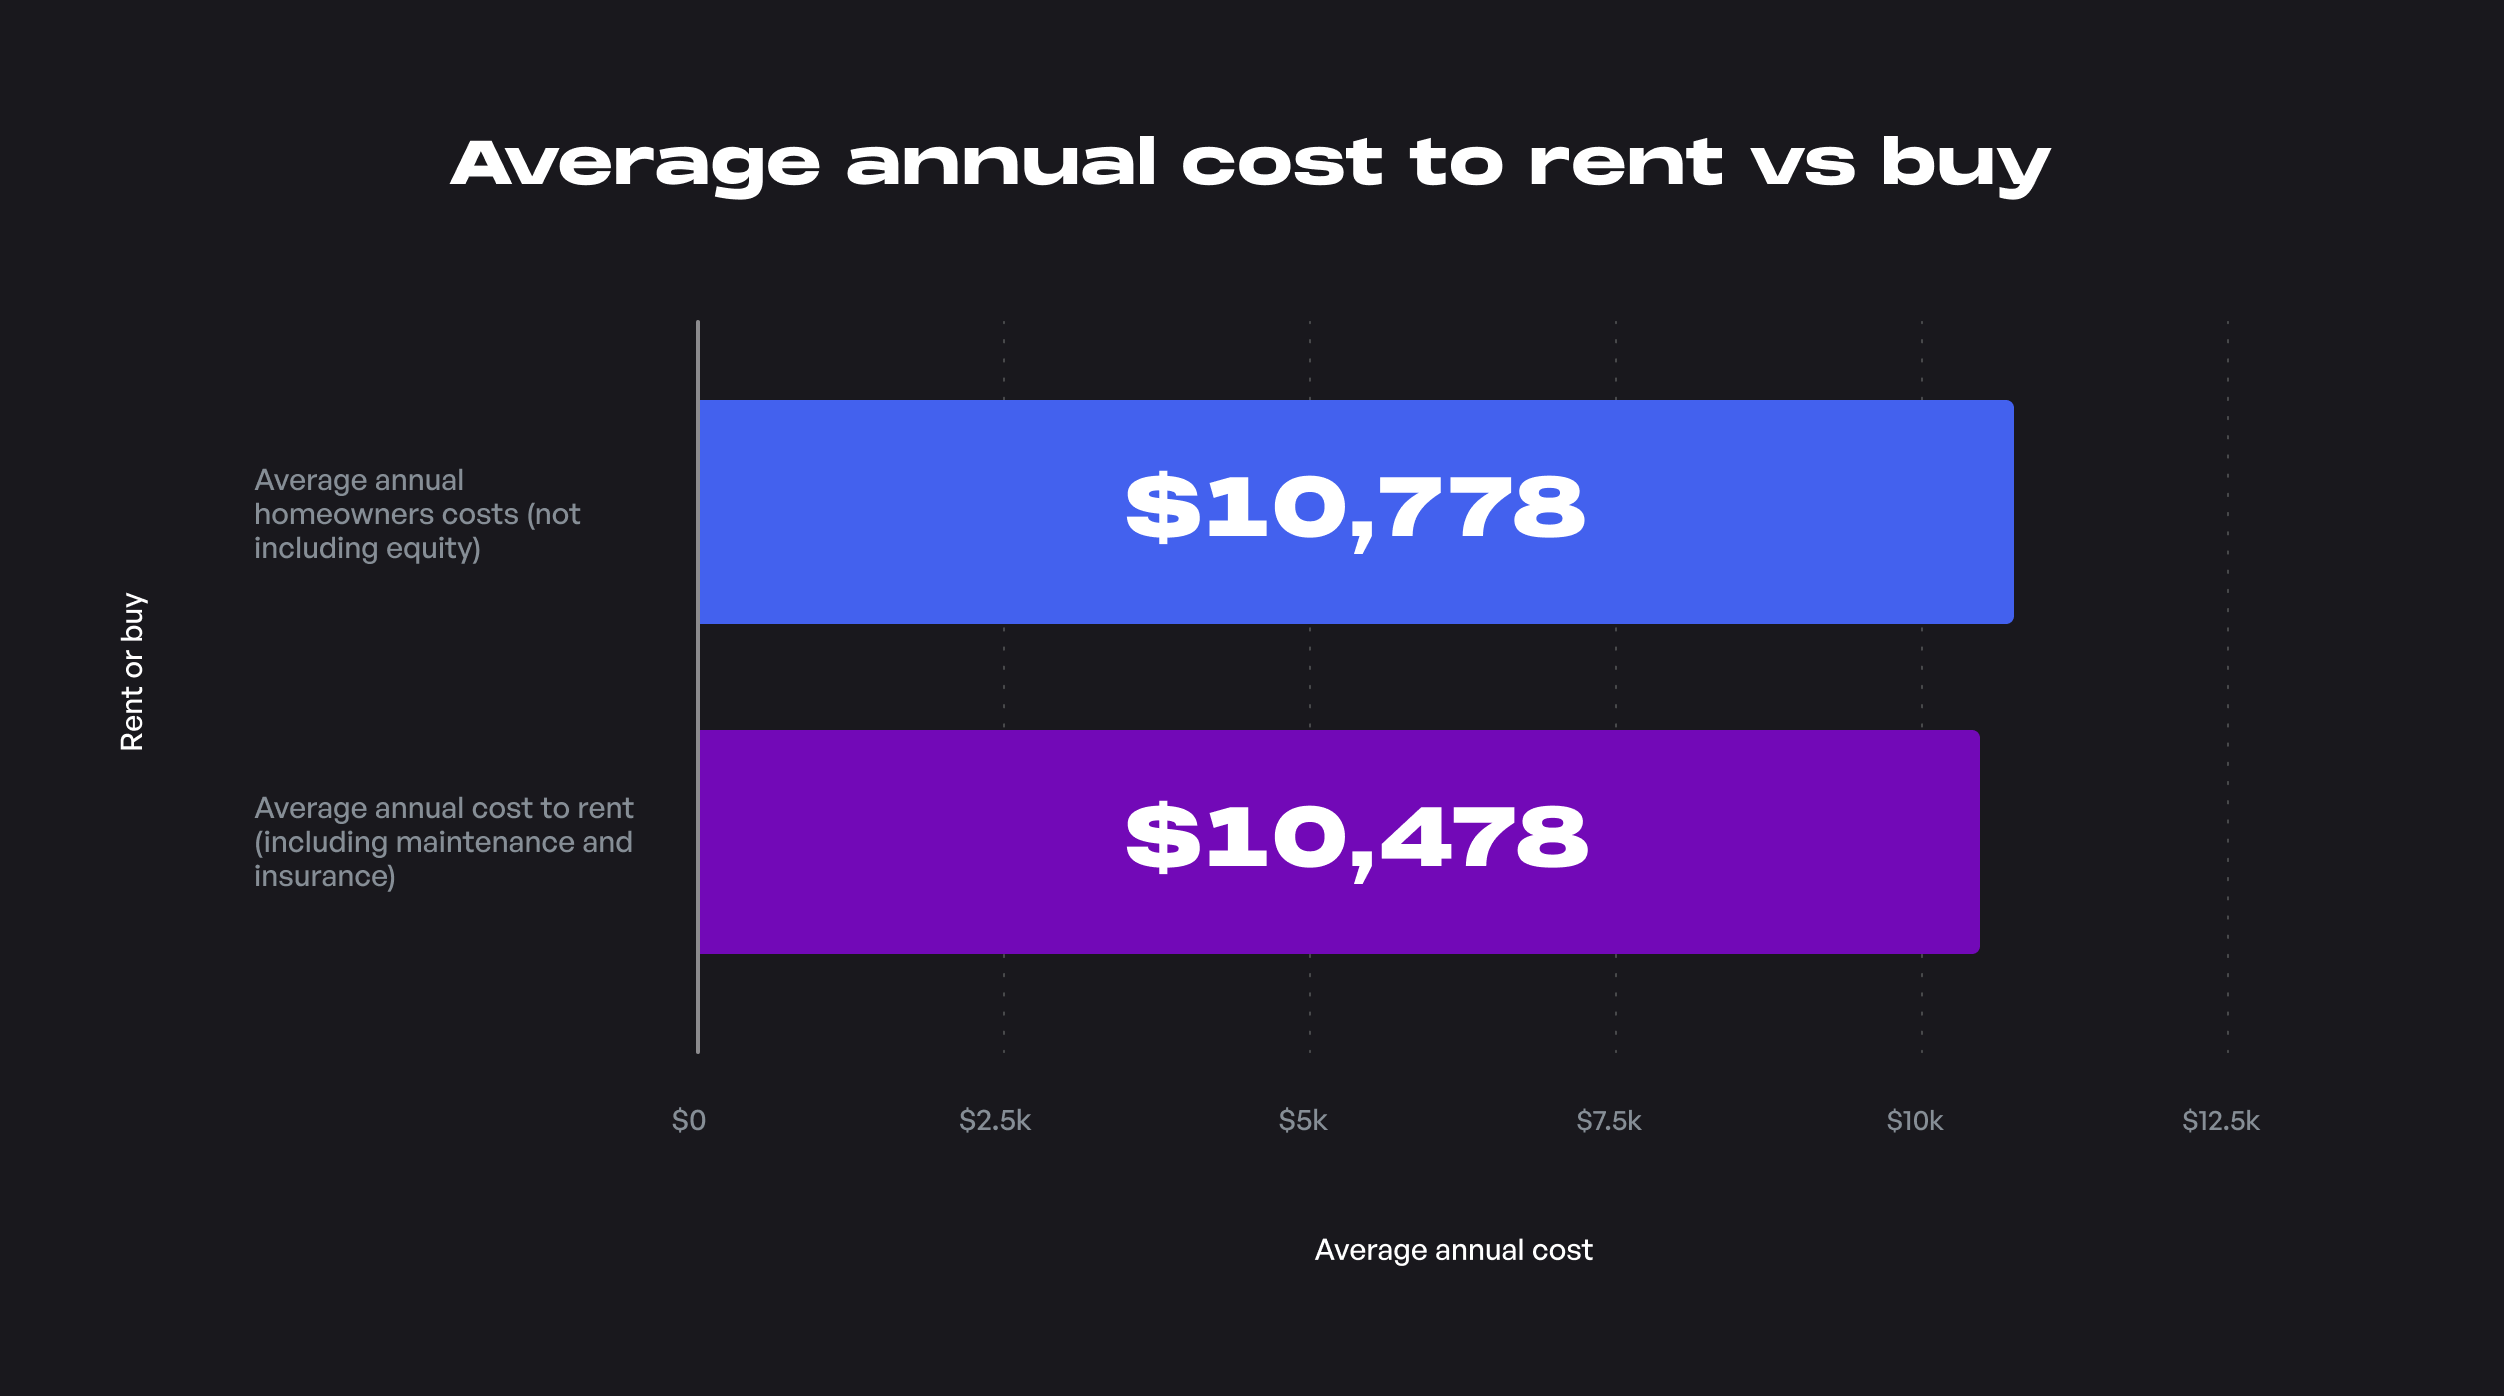
About two-thirds of U.S. households own their home, and more than 50% of homeowners currently have a mortgage. The average U.S. homeowner spends about $10,778 per year (~$958 a month) on mortgage interest, property taxes, and other expenses such as maintenance, repairs, and homeowners insurance.
The remaining one-third of Americans who rent pay slightly less to the tune of $10,478 per year (~$930 a month) for their rent, maintenance costs, and renters insurance.
When you're having trouble deciding whether to rent or buy, there are a few guidelines you can follow to help you make a decision.
Limit purchase to 2-2.5X gross income. With the average income being $84,352, this would be about $210,880.
Limit monthly housing costs (mortgage/rent, insurance, taxes, HOA, etc.) to 25% of bring-home income. With the average US household income being $84,352 and taxes at $10,811, according to this rule, your monthly housing costs should be about $1,532 ($18,384 annually).
Limit total monthly housing costs to 28-36% of gross income based on whether you want to be aggressive or conservative. According to this rule, taking the average household income as $84,352, your monthly housing costs should be about $1,968 to $2530 ($23,618 to $30366 annually).
How you can reduce expenses on mortgages
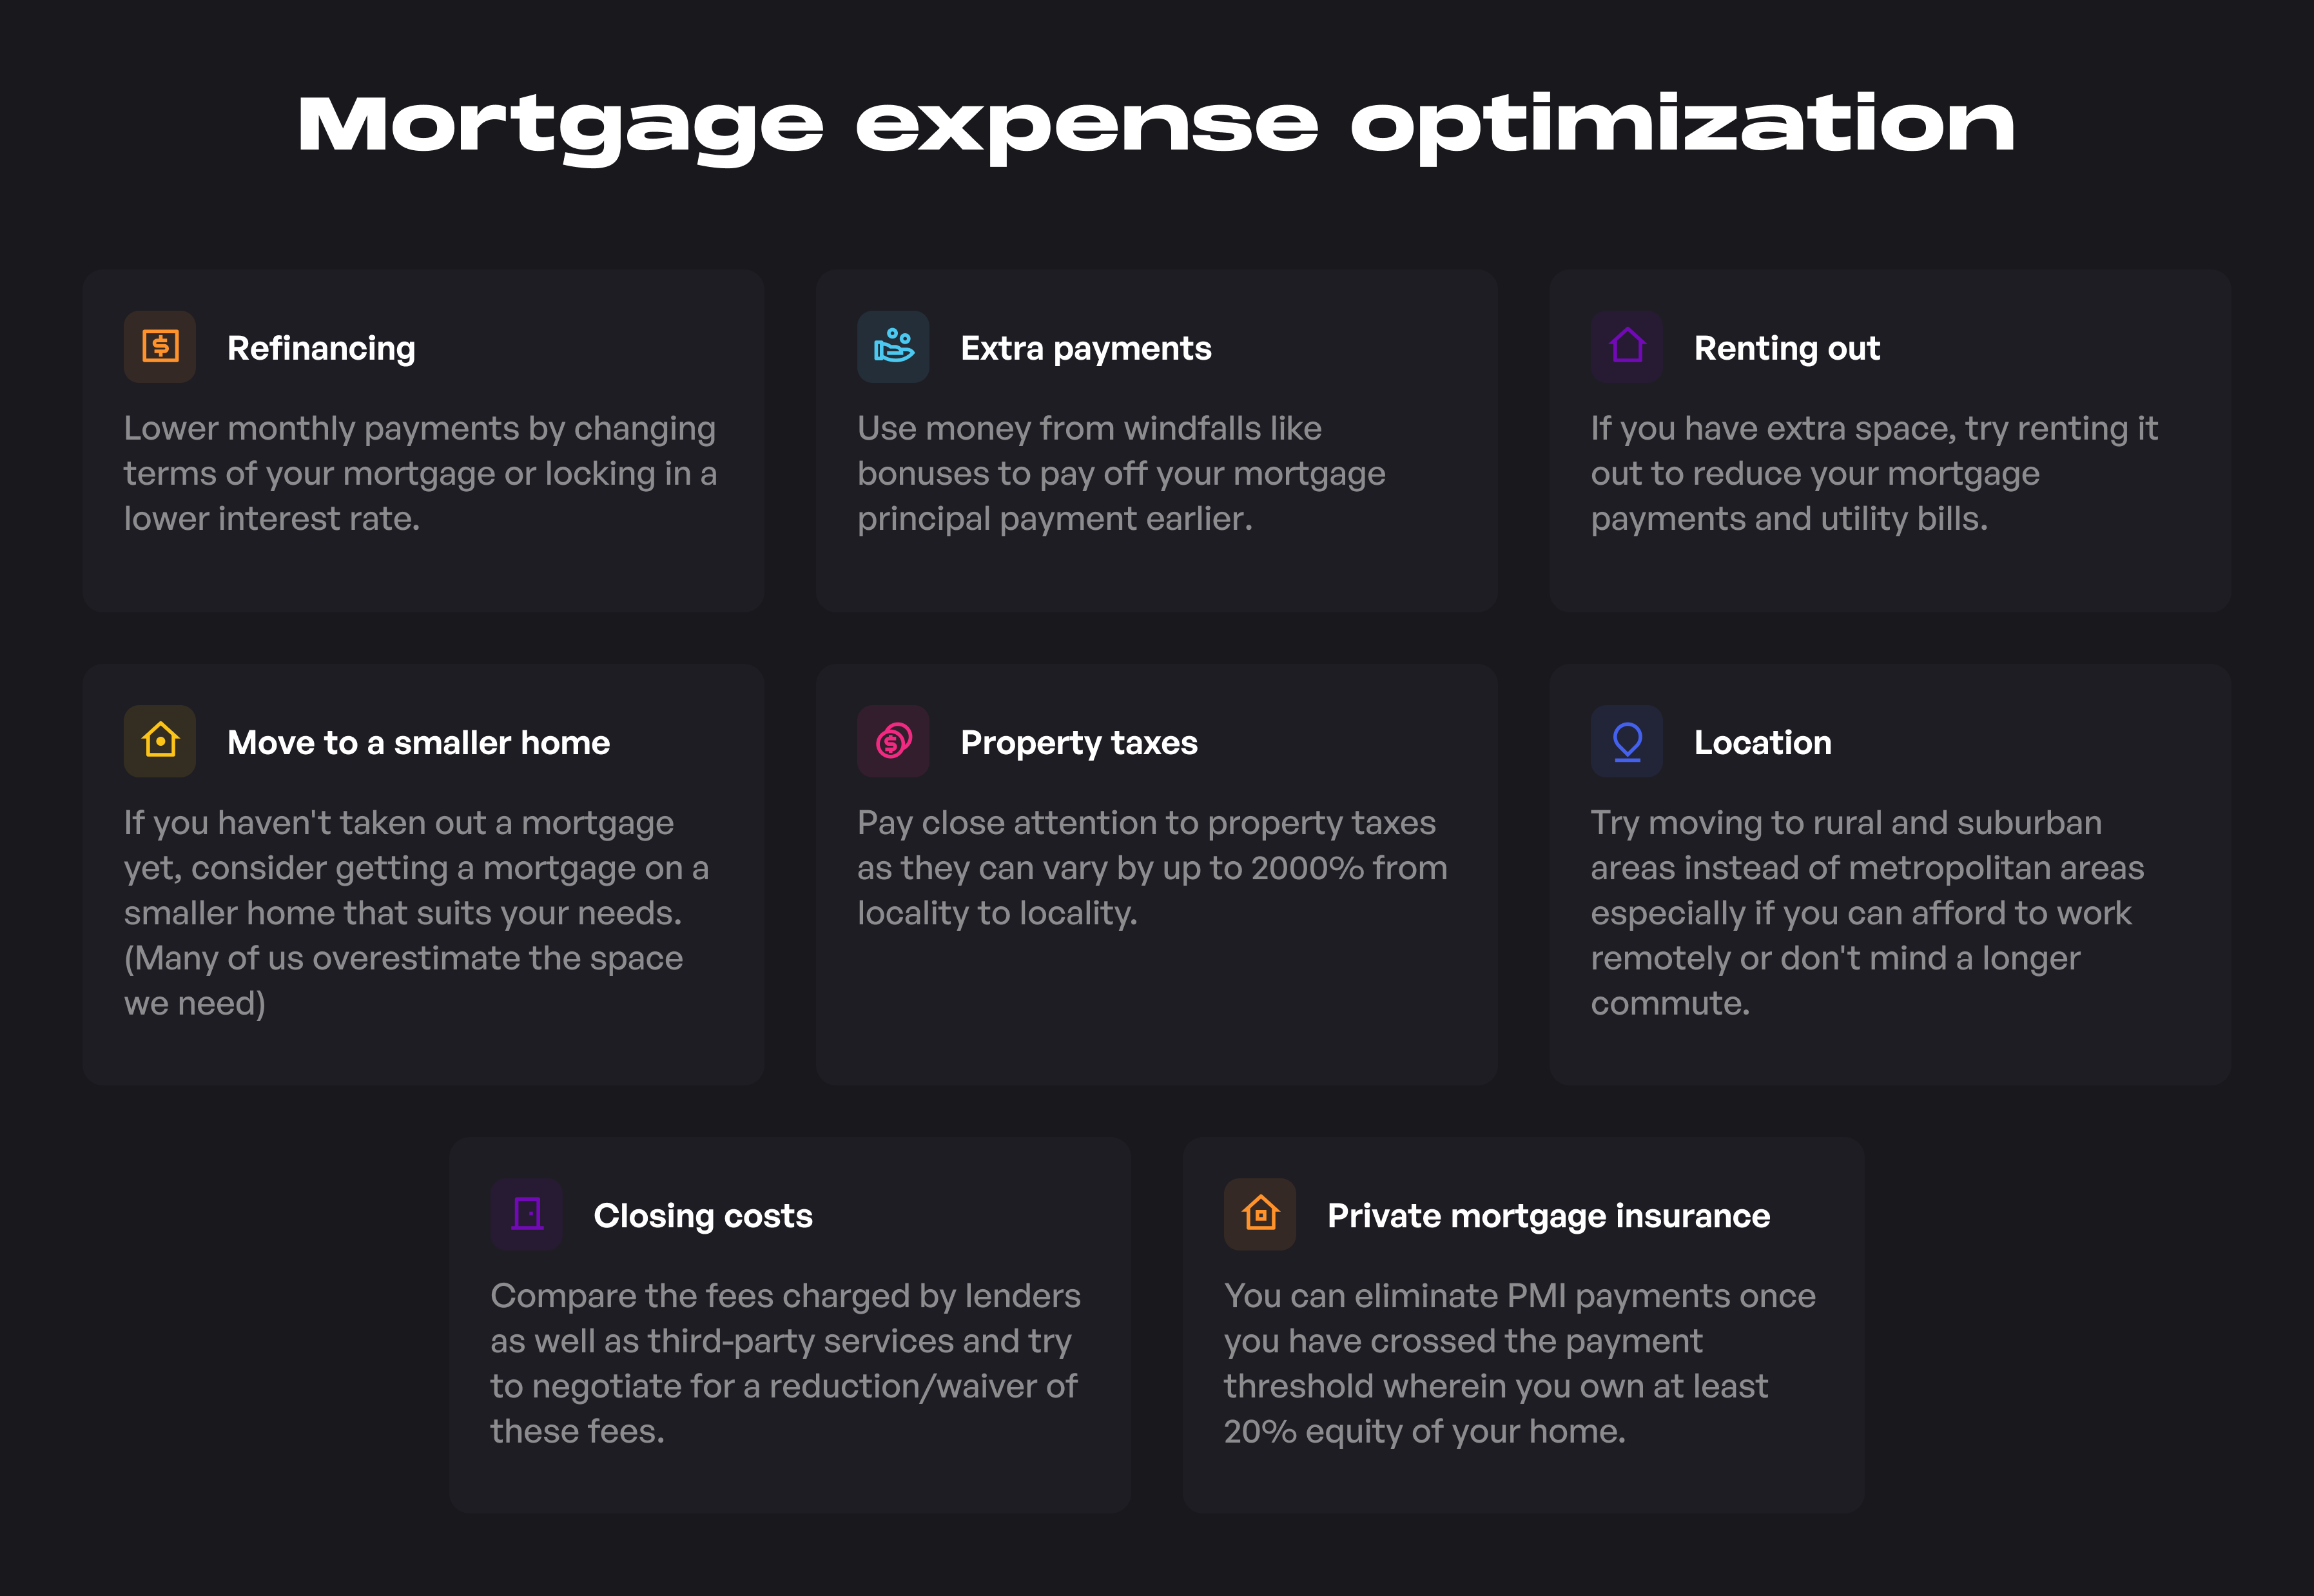
- Refinancing: Refinancing is a way to lower your monthly mortgage payments by changing the terms or type of mortgage you have (fixed rate, adjustable rate, balloon) or by locking in a low-interest rate. You can use both the above ways to reduce your monthly mortgage payments significantly.
- Make an extra payment every year: When you get a bonus at work or a sudden windfall of cash, use it to pay off your principal balance. This windfall can be in the form of bonuses, raises, tax refunds, and more.
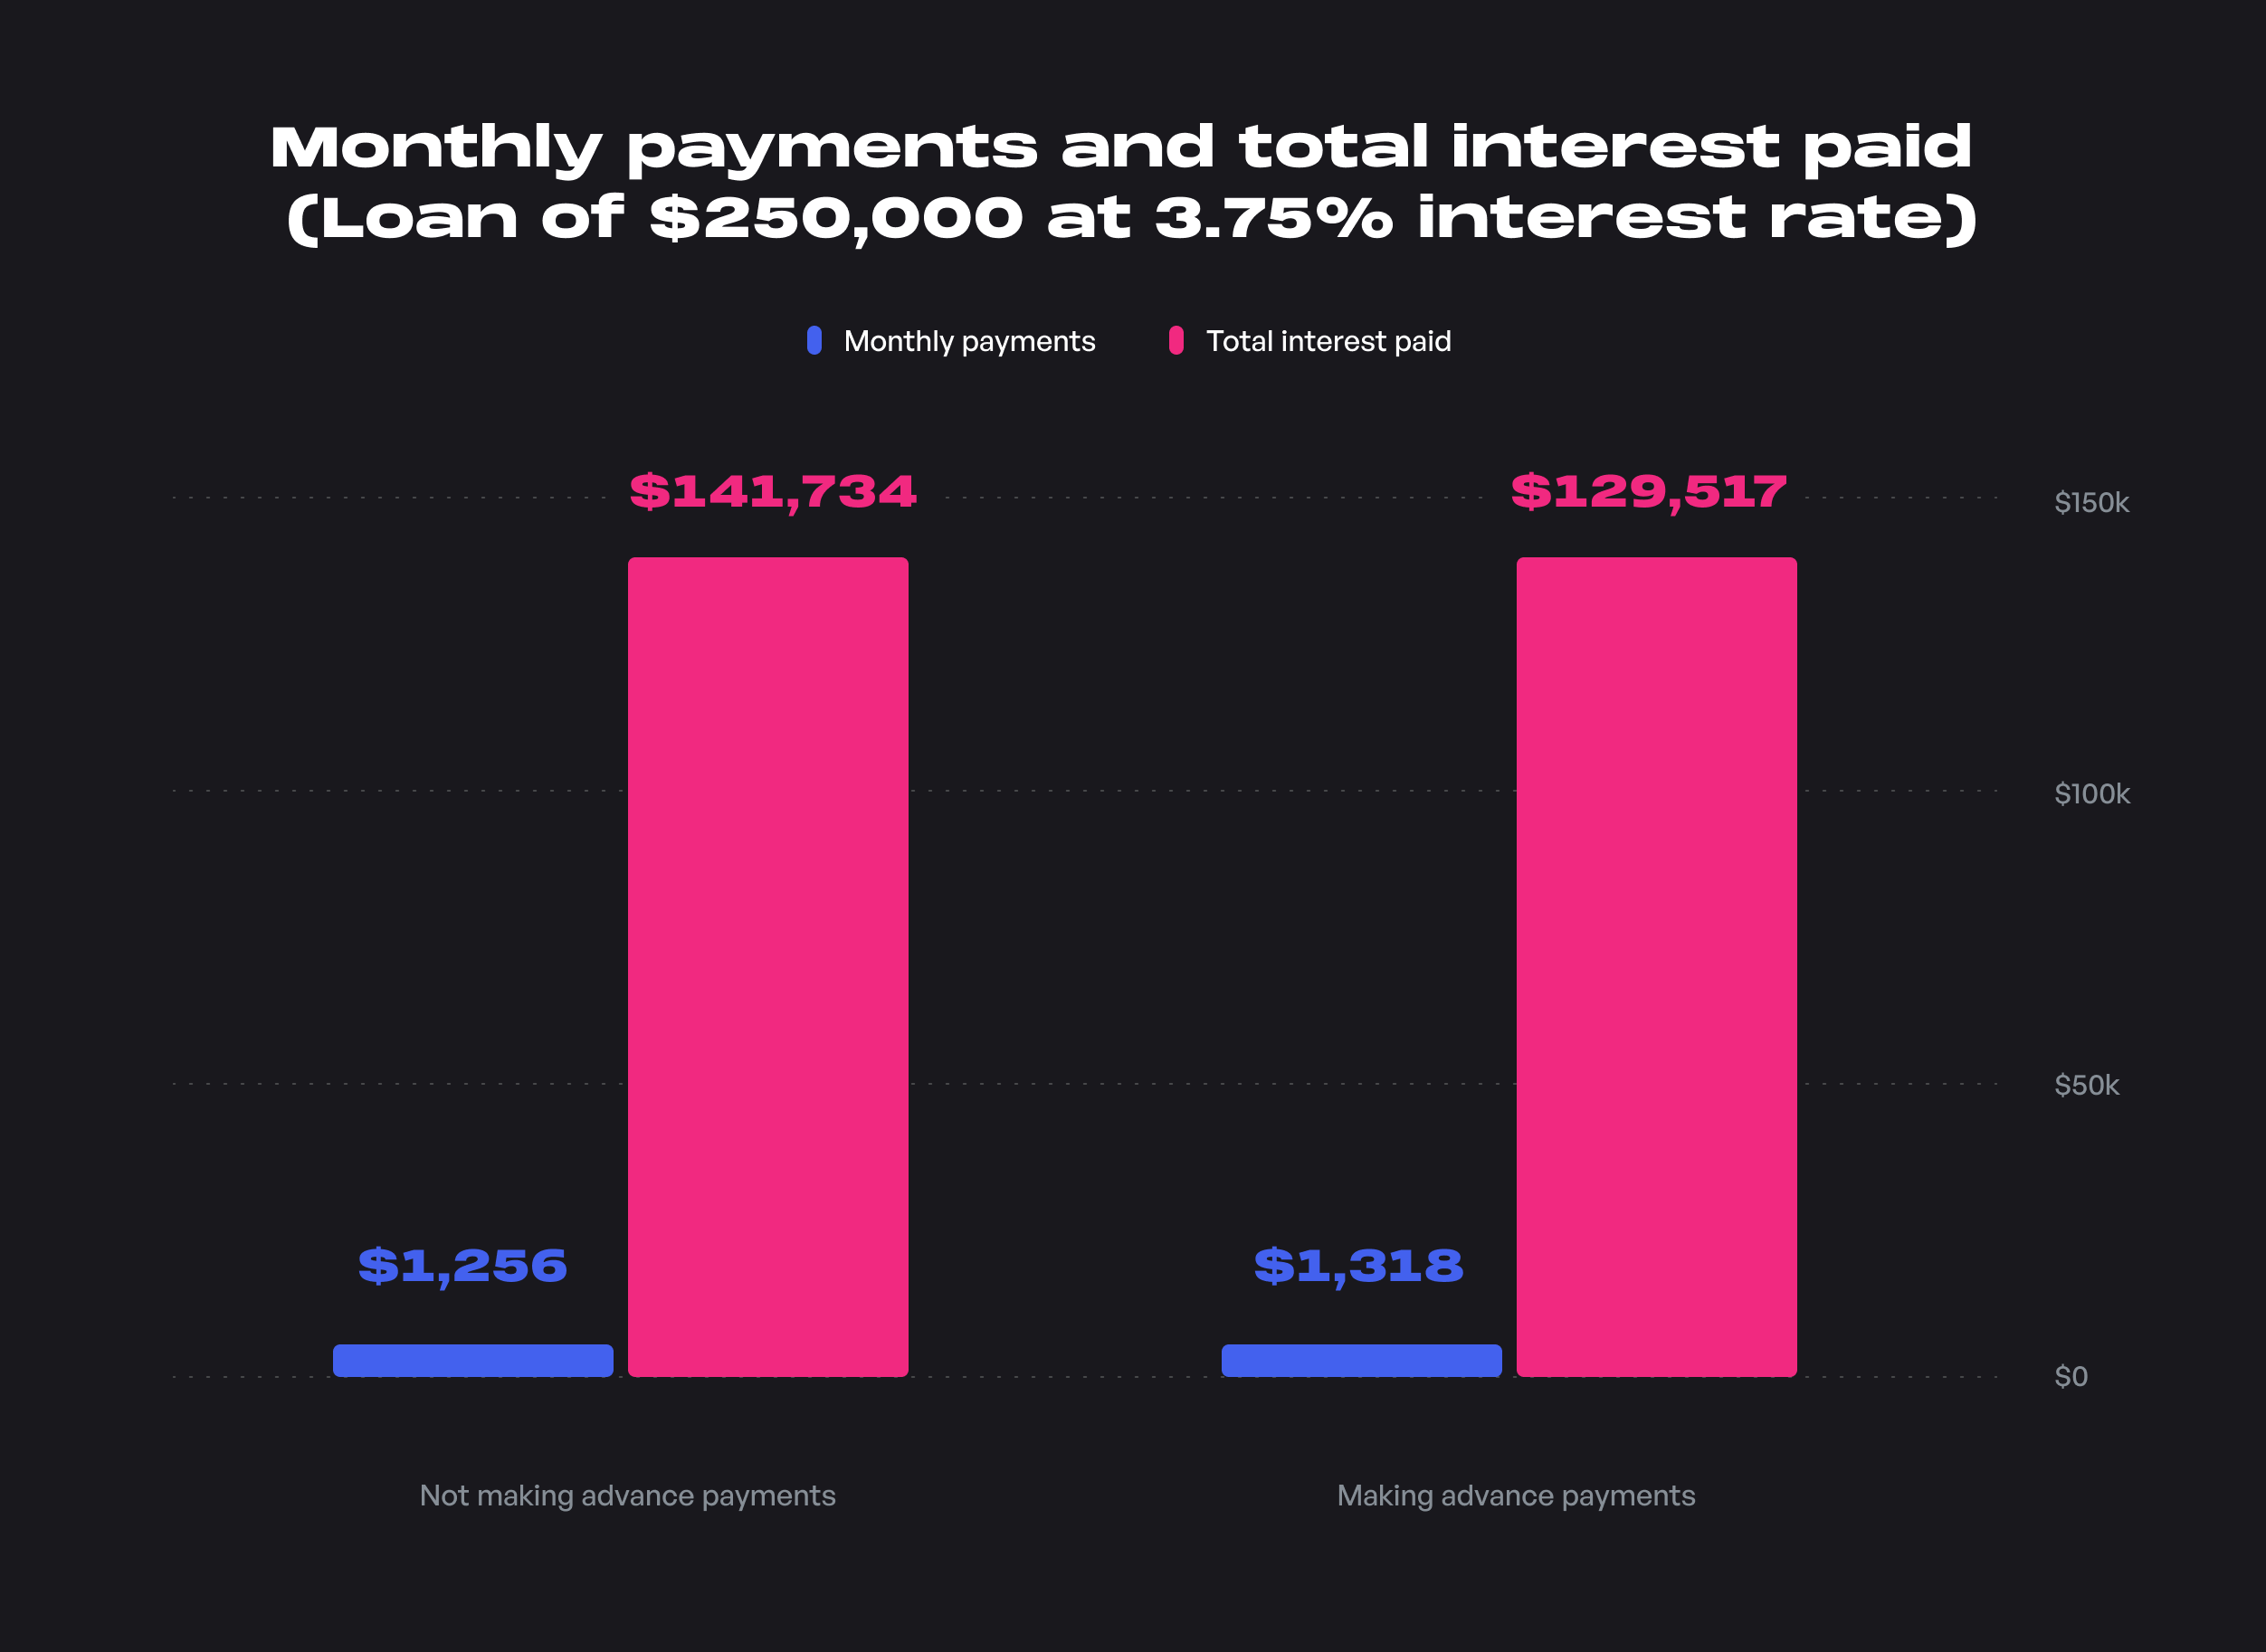
If you paid off just one extra monthly mortgage payment a year, you could save $12,217 in interest charges.
- Rent out a room: If you have any extra living space in your home, you could rent it out to pay off a portion of your monthly mortgage payments. This could increase your disposable income, which you could save and then invest appropriately. If your home is next to a university, you could consider renting out a room to a student.
- Save on property taxes: Property tax rates can vary from 0.2% to almost 4% of the value of your home (that's a 2000% difference!) based on the locality.
- Move further away from the city: If you work remotely or don't mind a slightly longer commute, moving into suburban or rural areas can lead to a drastic reduction in monthly payments.
- Trim closing costs: There are many fees associated with getting a mortgage. These include lender fees as well as third-party fees from credit reporting agencies. You can comparison shop on all of these fees!
- End your private mortgage insurance early: If you bought your home with less than 20% down, you’d have to pay Private Mortgage Insurance, which protects lenders if homeowners default on the loan. The good news is that you can eliminate the PMI payment once you cross the 20% equity threshold. These fees can be waived faster if you make extra payments during windfalls.
How you can reduce expenses on rent

- Get a roommate: If you live alone, you could consider getting a roommate or two. This could help you reduce your expenses not only on the rent but also on the utility bills! The average monthly rent of a two-bedroom apartment in the US in 2021 is $1,934. If you have two roommates, that cost comes down to $644, a savings of $1290 a month, and a whopping $15,480 a year.
- Negotiate with your landlord: If you’ve always paid your rent on time and have had no issues, it’s okay to negotiate your rent with your landlord as it would be mutually beneficial for both of you in the long run.
- Switch your location: As with purchasing a home, the location is a significant factor that decides how much rent you pay! If possible, look for places to rent in suburbs and rural areas instead of the hustle and bustle of the high-rent metropolitan regions.
- Sign an extended lease: If you’re sure that you will stay in a particular city for an extended period, you can sign an extended lease for a year or two instead of 6 months. This would give the landlord stability of income and, therefore, open to negotiation on the monthly rent payments.
Utilities and other household operational expenses
The average American household spends about $8,806 on utilities and other household operational expenses and equipment. The most significant expenses are monthly recurring payments for electricity, heating and gas, water/sewer/septic, trash collection, and phone service (including cell phones).
Also, a little over 70% of Americans spend money on household services like babysitting or elder care, house cleaning or lawn mowing, laundry and dry cleaning, pest control, and home security systems. This part of expenses comes to about $1,465 on average (or $122 per month).
The last significant expense under this category is furnishings and equipment. This includes purchasing new household electronic appliances from refrigerators, computers, and air-conditioners to furniture like a new dining table and chairs to cooking-related purchases like barbeques and ovens and finally low-cost purchases such as curtains, drapes, towels, etc.
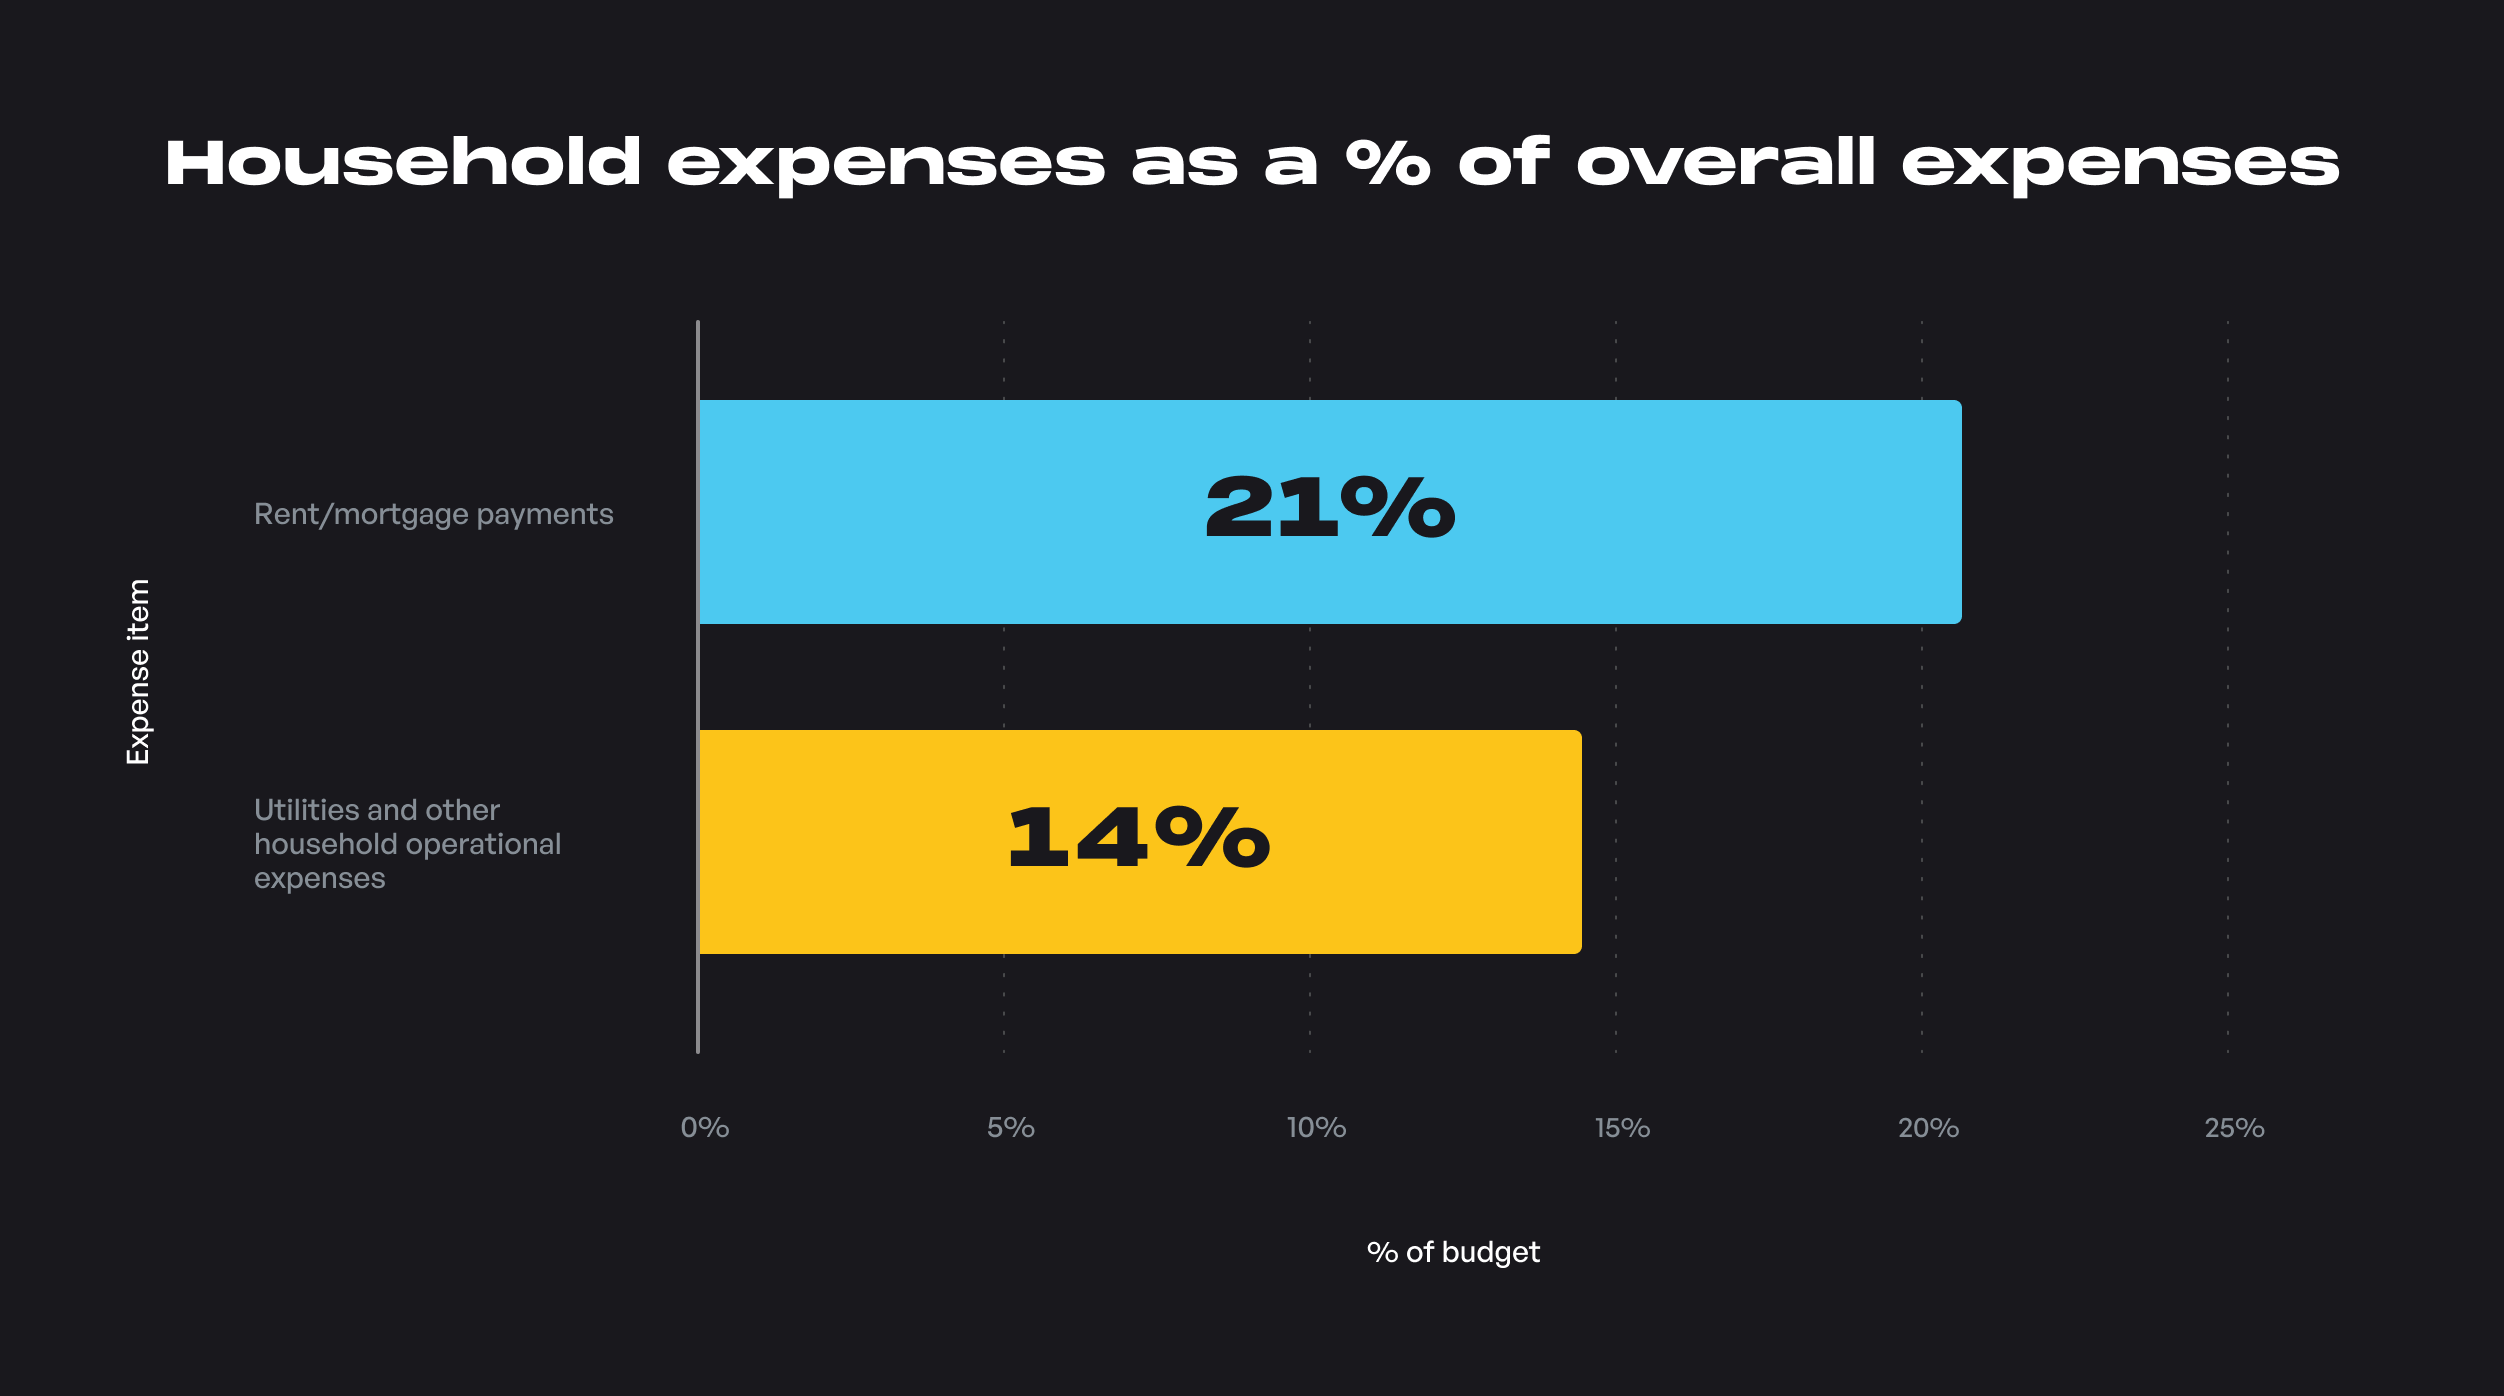
The average US household spends about 14% of its household budget on utilities and other operational expenses. A further 21% of their budget on rent or mortgage brings the combined total expenditure on housing expenses to a whopping 35% or $21,409 per year. This means that this expenditure category should be a significant focus of trying to optimize spending and reduce expenses as minor tweaks can significantly reduce expenses.
How you can reduce household expenses
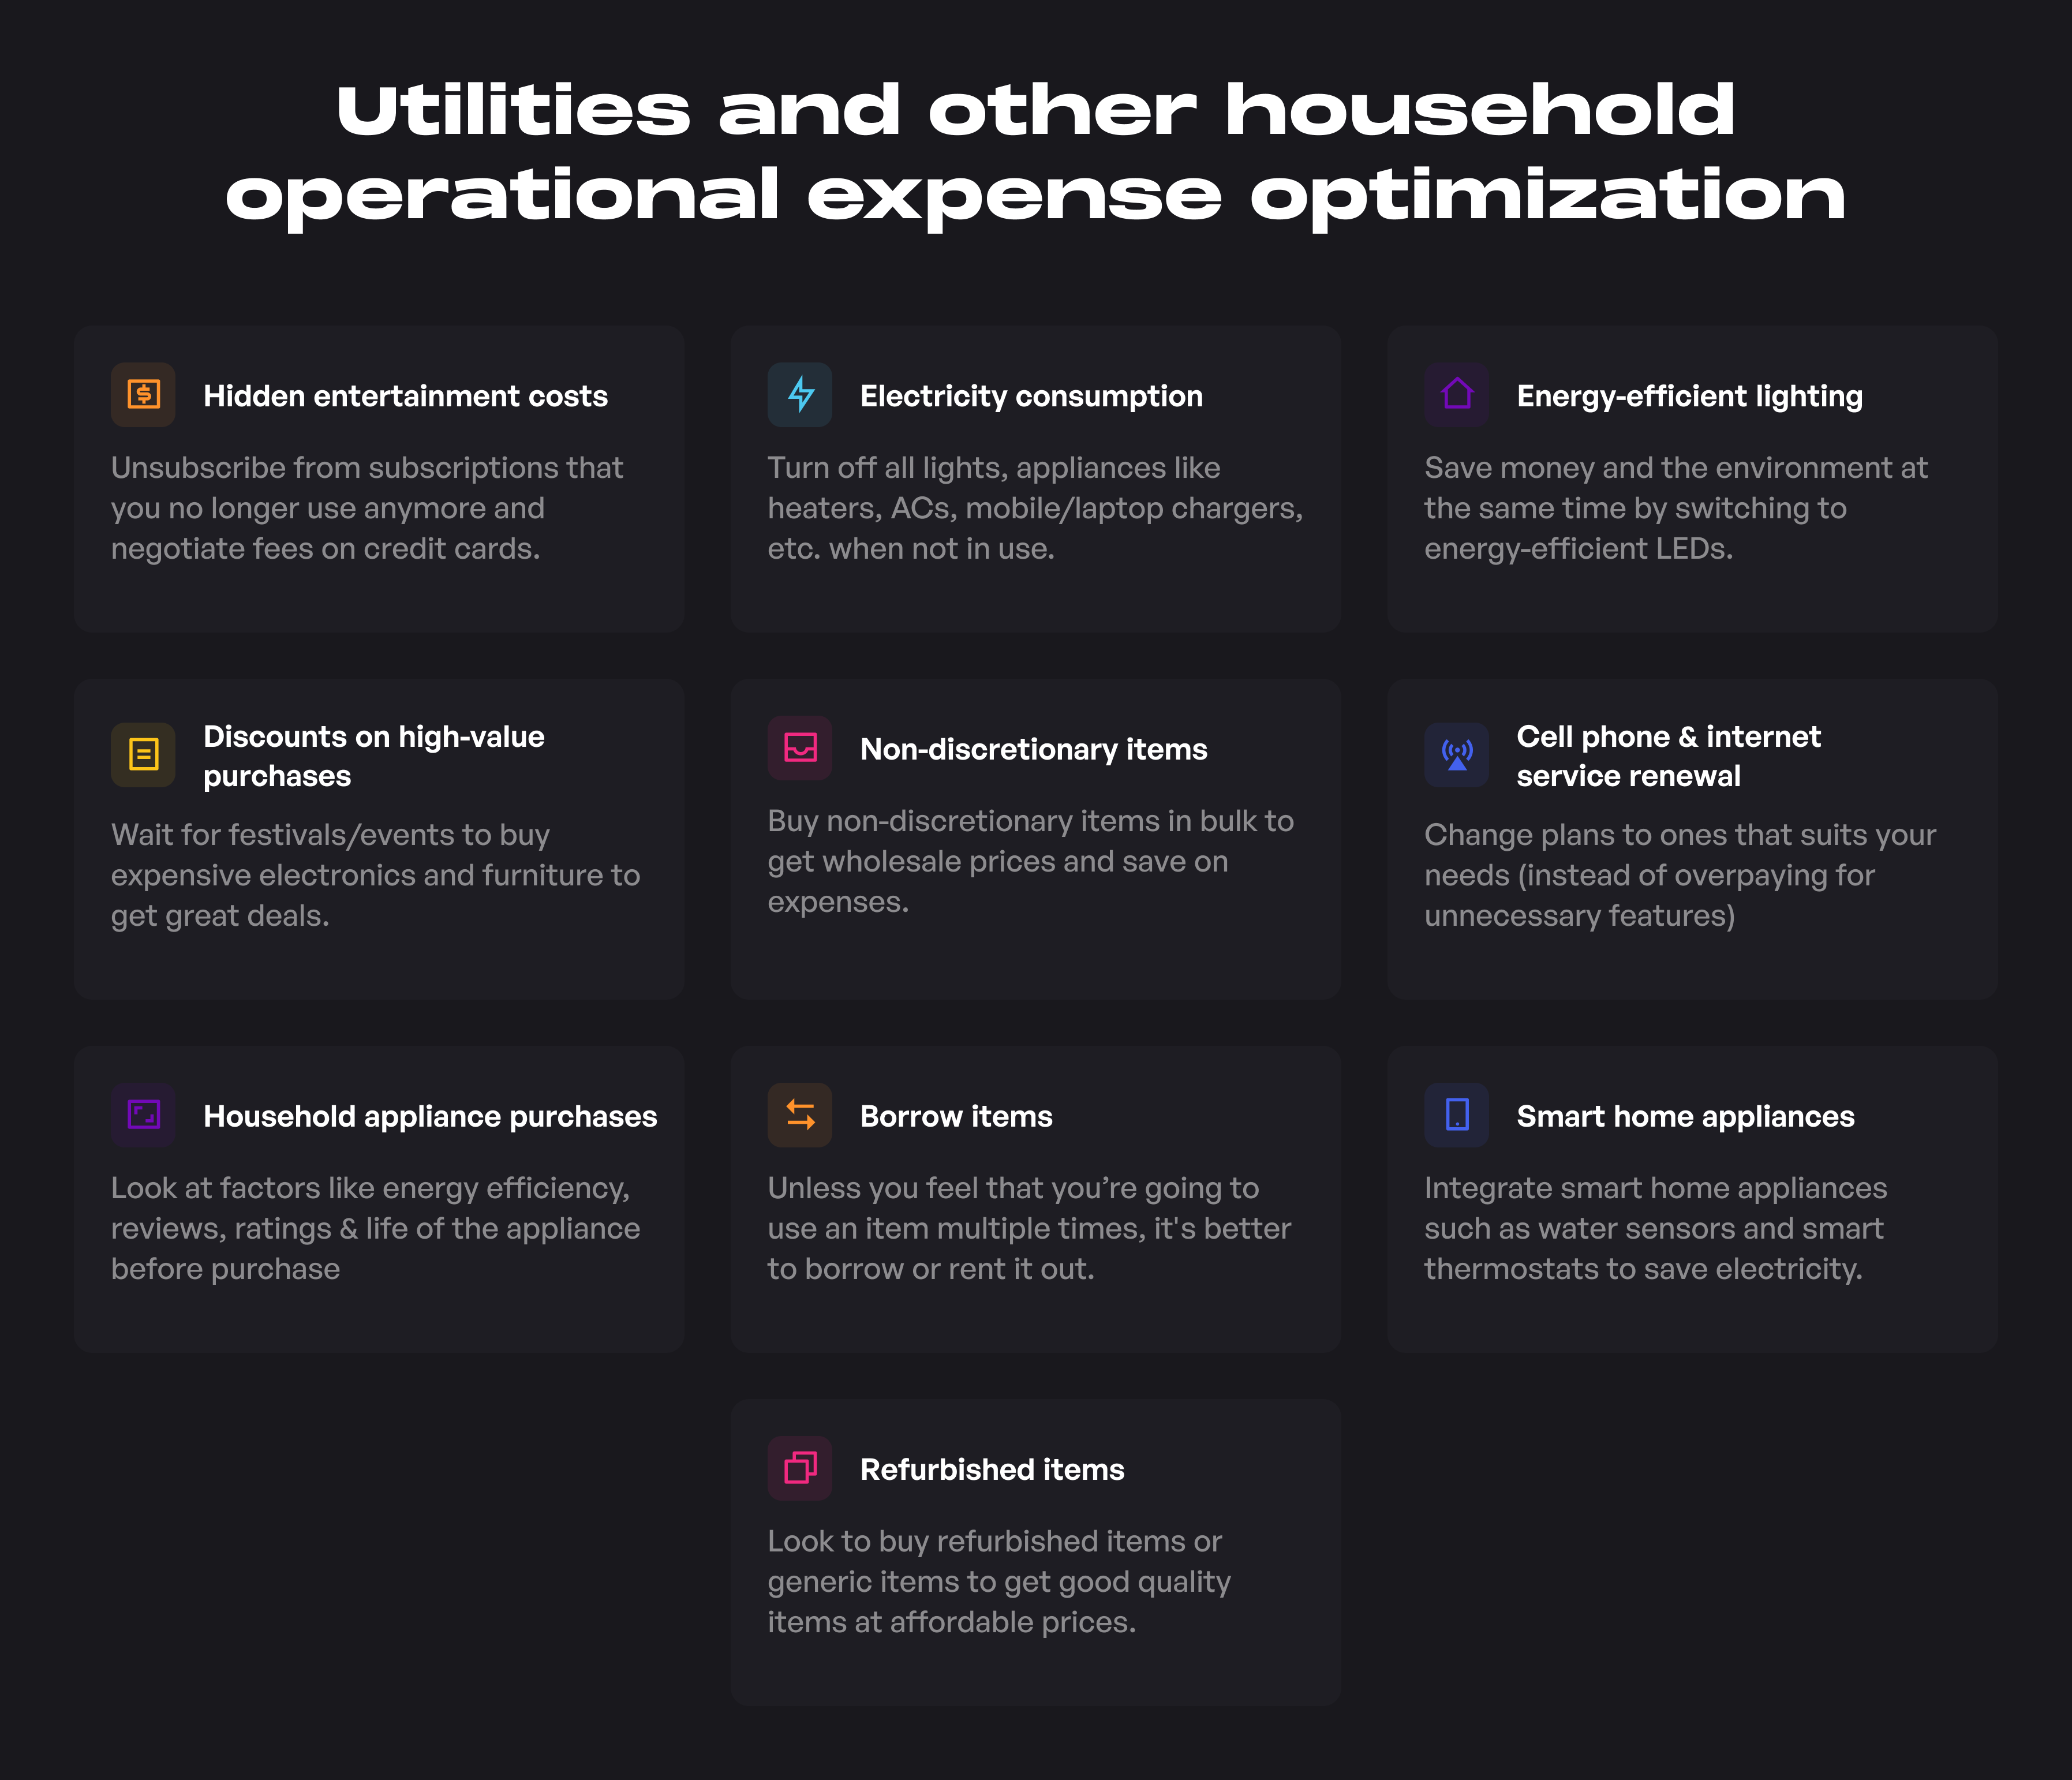
- Remove hidden entertainment costs: Take a look at your monthly expenses and see if there are services that you no longer use. This could be an individual Netflix subscription, cloud storage that you don't need anymore, cable or satellite bills, etc. This can also be extended to monthly recurring product/magazine subscriptions and monthly/yearly fees on credit cards that you don't use anymore. For example, you can ask the issuer to waive fees on travel or hospitality credit cards that you would not be able to use in case of further lockdowns.
- Reduce your electricity consumption: In addition to turning off lights, heaters, or air-conditioners when not in use, remember to turn off the switch for appliances like laptop and phone chargers, microwave ovens, and PC’s when not in use.
- Switch to more energy-efficient lighting: What if you could save money and the environment simultaneously? It’s a win-win, right? Switch out your incandescent light bulbs with energy-efficient LEDs to save electricity and the planet.
- Look for deals and sales while making high - value purchases: For high-value purchases like electronics and furniture, it’s good to wait for festivals or events when there’s bound to be sales and discounts. By doing this, you can bundle purchases together to get a better deal and save more.
- Buy non-discretionary items wholesale: Whenever possible, buy non-discretionary items (for example, toilet paper and wipes) at wholesale prices to get discounts.
- Renew cell phone and internet services: You could be overpaying for both your phone and internet services. Do a quick shop around to check whether you can negotiate a better rate that suits your usage and remove unnecessary add-ons that you don't use.
- Purchase household appliances sensibly: When you’re looking to purchase new appliances at home, look at factors like energy efficiency, reviews and ratings, the life of the appliance , and so on. Also, compare prices across large retailers. Finally, after you have purchased the appliance, do your part in maintaining it well so that it functions smoothly and results in fewer expenses spent on repairs and replacements.
- Borrow instead of buying for one-off events: We all have that one item in our homes that we've used only once and never touched again. Look for ways to borrow or rent out the items necessary to accomplish the task. Another way to increase savings here is to sell off items that you don't need anymore (especially those one-off items gathering dust!).
- Invest in smart home appliances: Purchase and integrate smart home appliances such as fire and smoke sensors , home security via apps, water sensors to detect and alert you of leakages, as well as smart thermostats to regulate and monitor home temperatures for maximum savings and maintaining optimal temperatures.
- Buy refurbished/generic items: Especially with electronic items, almost 20-30% of the value is lost as soon as you take it out of the box. It could be prudent to look for refurbished items that are almost as good as brand new on sites like eBay. Do note that you have to ensure quality and it might be worth getting a professional to take a quick look at the item if you don't know how to check an appliance yourself. Watching a few videos on YouTube about how to check for quality issues with the said appliance can certainly help your cause!
Transportation
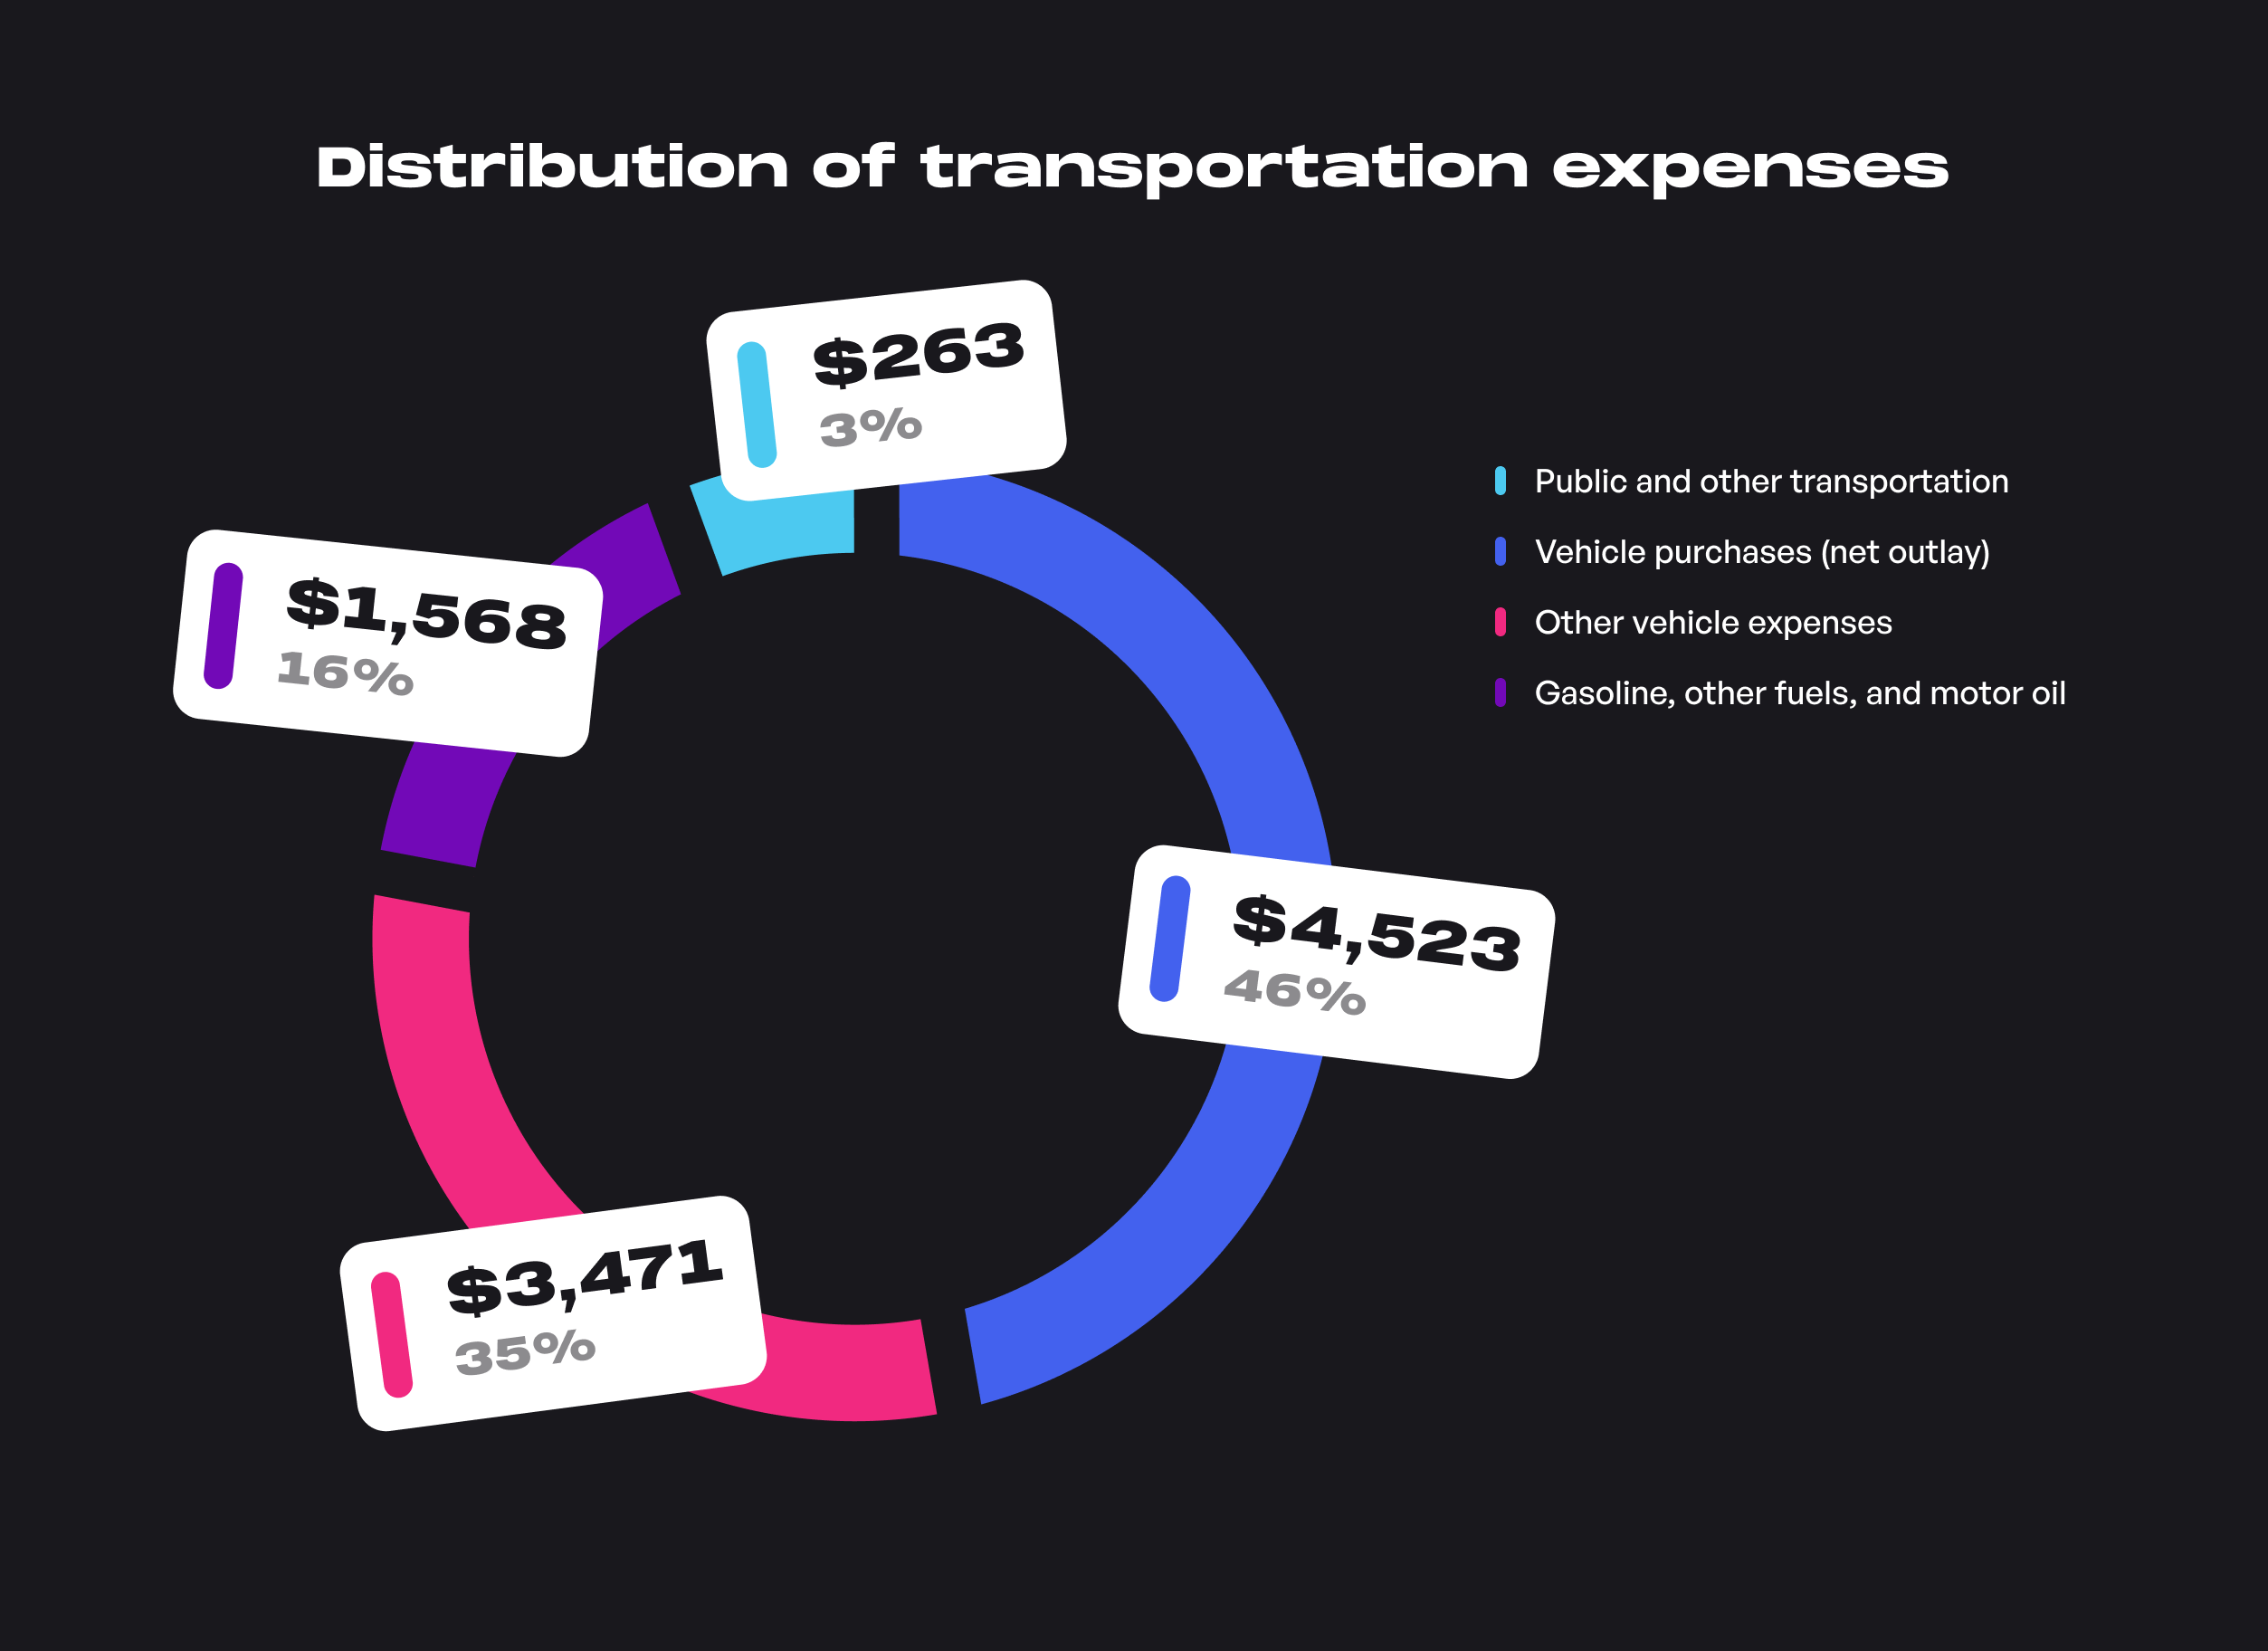
Transportation is the second-largest category of spending for the average US household. It accounts for a huge 16% of household expenditures!
Spending on transportation is in the tune of $9,825 annually ($820/month). This includes all costs related to transportation including purchases of vehicles, gasoline, oil changes, and other vehicular expenses such as car insurance, and money spent on traveling by public transportation or rideshares.
A rule of thumb to keep in mind when purchasing a car to see if you can afford it is the 20/4/10 rule.
- Down payment: 20 % of the purchase value of the car
- Loan terms: 4 -year loan or less
- Expenses towards the car: ≤ 10 % of your gross monthly income (this includes expenses towards fuel, auto insurance, DMV fees, repairs, parking/speeding tickets, and interest payments).
For the average US household earning $84,352 a year before taxes, if you want to purchase a car worth $45,000 you need to put a down payment of $9,000 (20%), pay the remaining amount within the next 4 years, and limit your monthly transportation expenses to less than $702 ($8,435 annually).
How you can optimize and save on transportation expenses
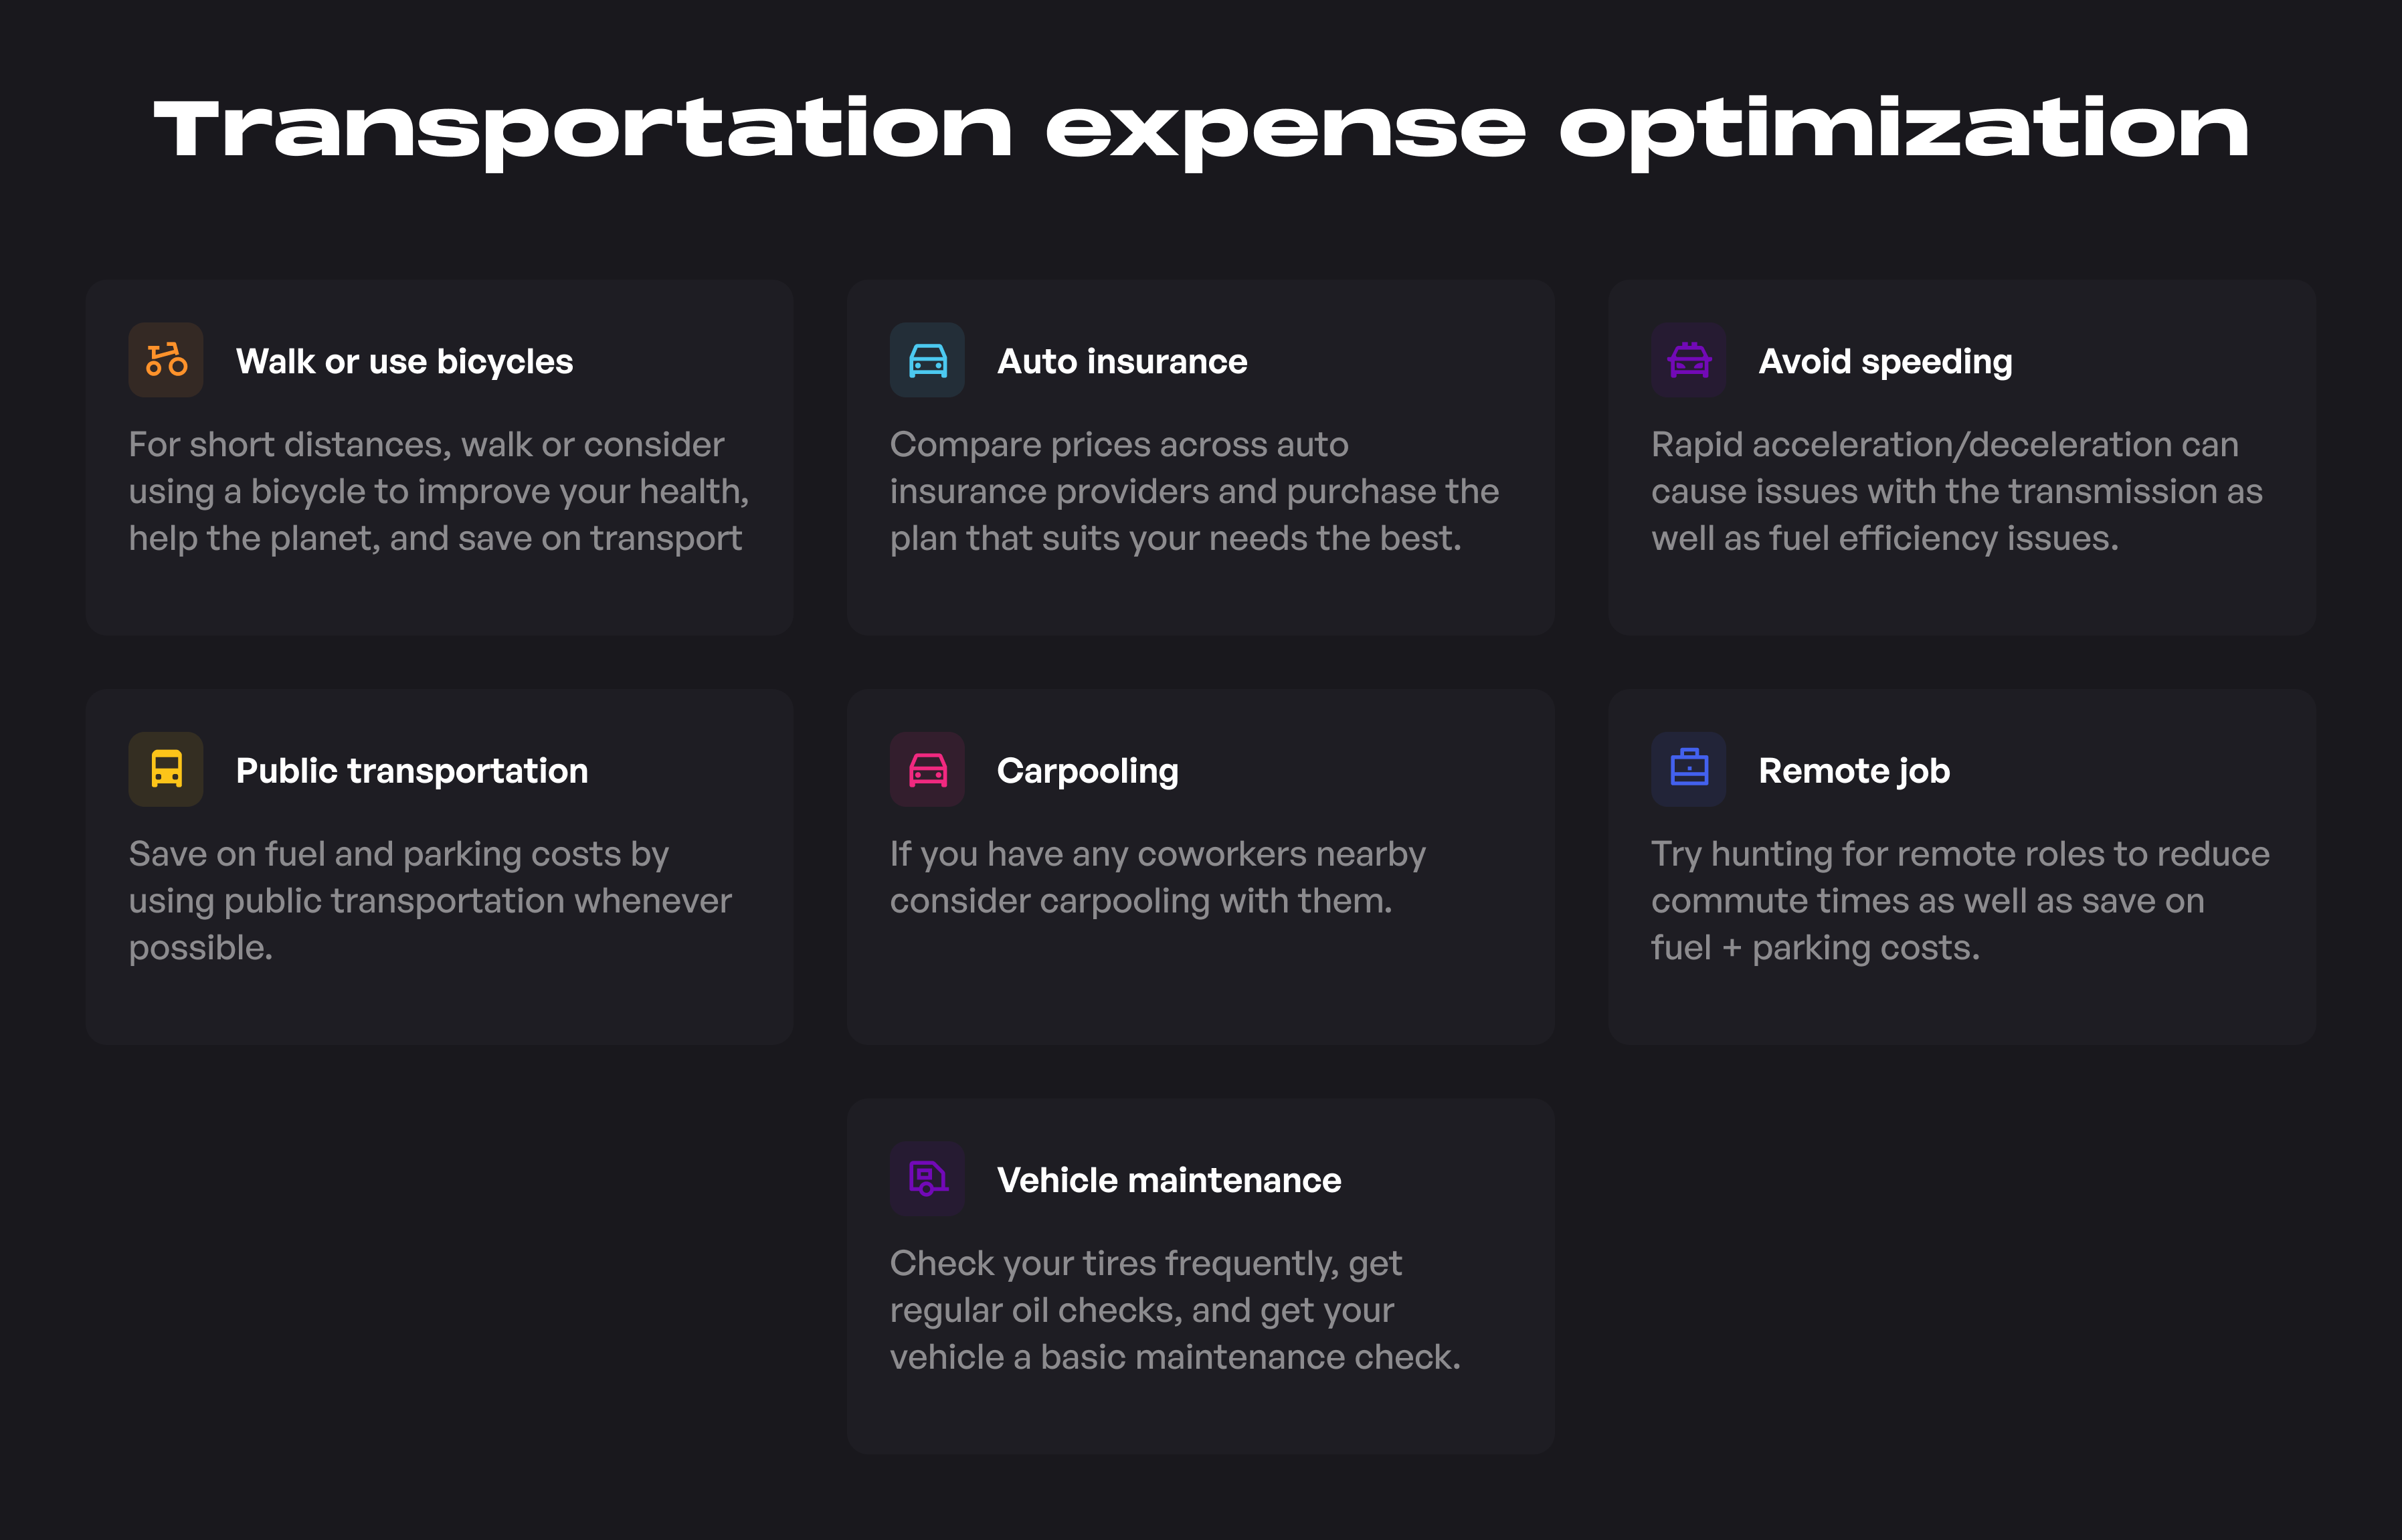
- Walk or use a bicycle for short distances: The majority of the automobile trips taken in the US are for short distances. Consider using a bike or walking to enjoy the benefits of improving your health, saving on transportation costs, and reducing emissions.
- Compare auto insurance costs: Prices vary by provider so make sure to shop around to get the insurance plan that suits your needs the best. If you have a good credit rating , have no history of accidents, and other favorable characteristics, some insurers will give you discounted insurance rates.
- Avoid speeding: Rapid acceleration and deceleration increases fuel consumption and may cause issues with the transmission in the long run. By avoiding speeding, you can improve your safety as well as boost the fuel economy of your car while reducing maintenance costs due to rough use.
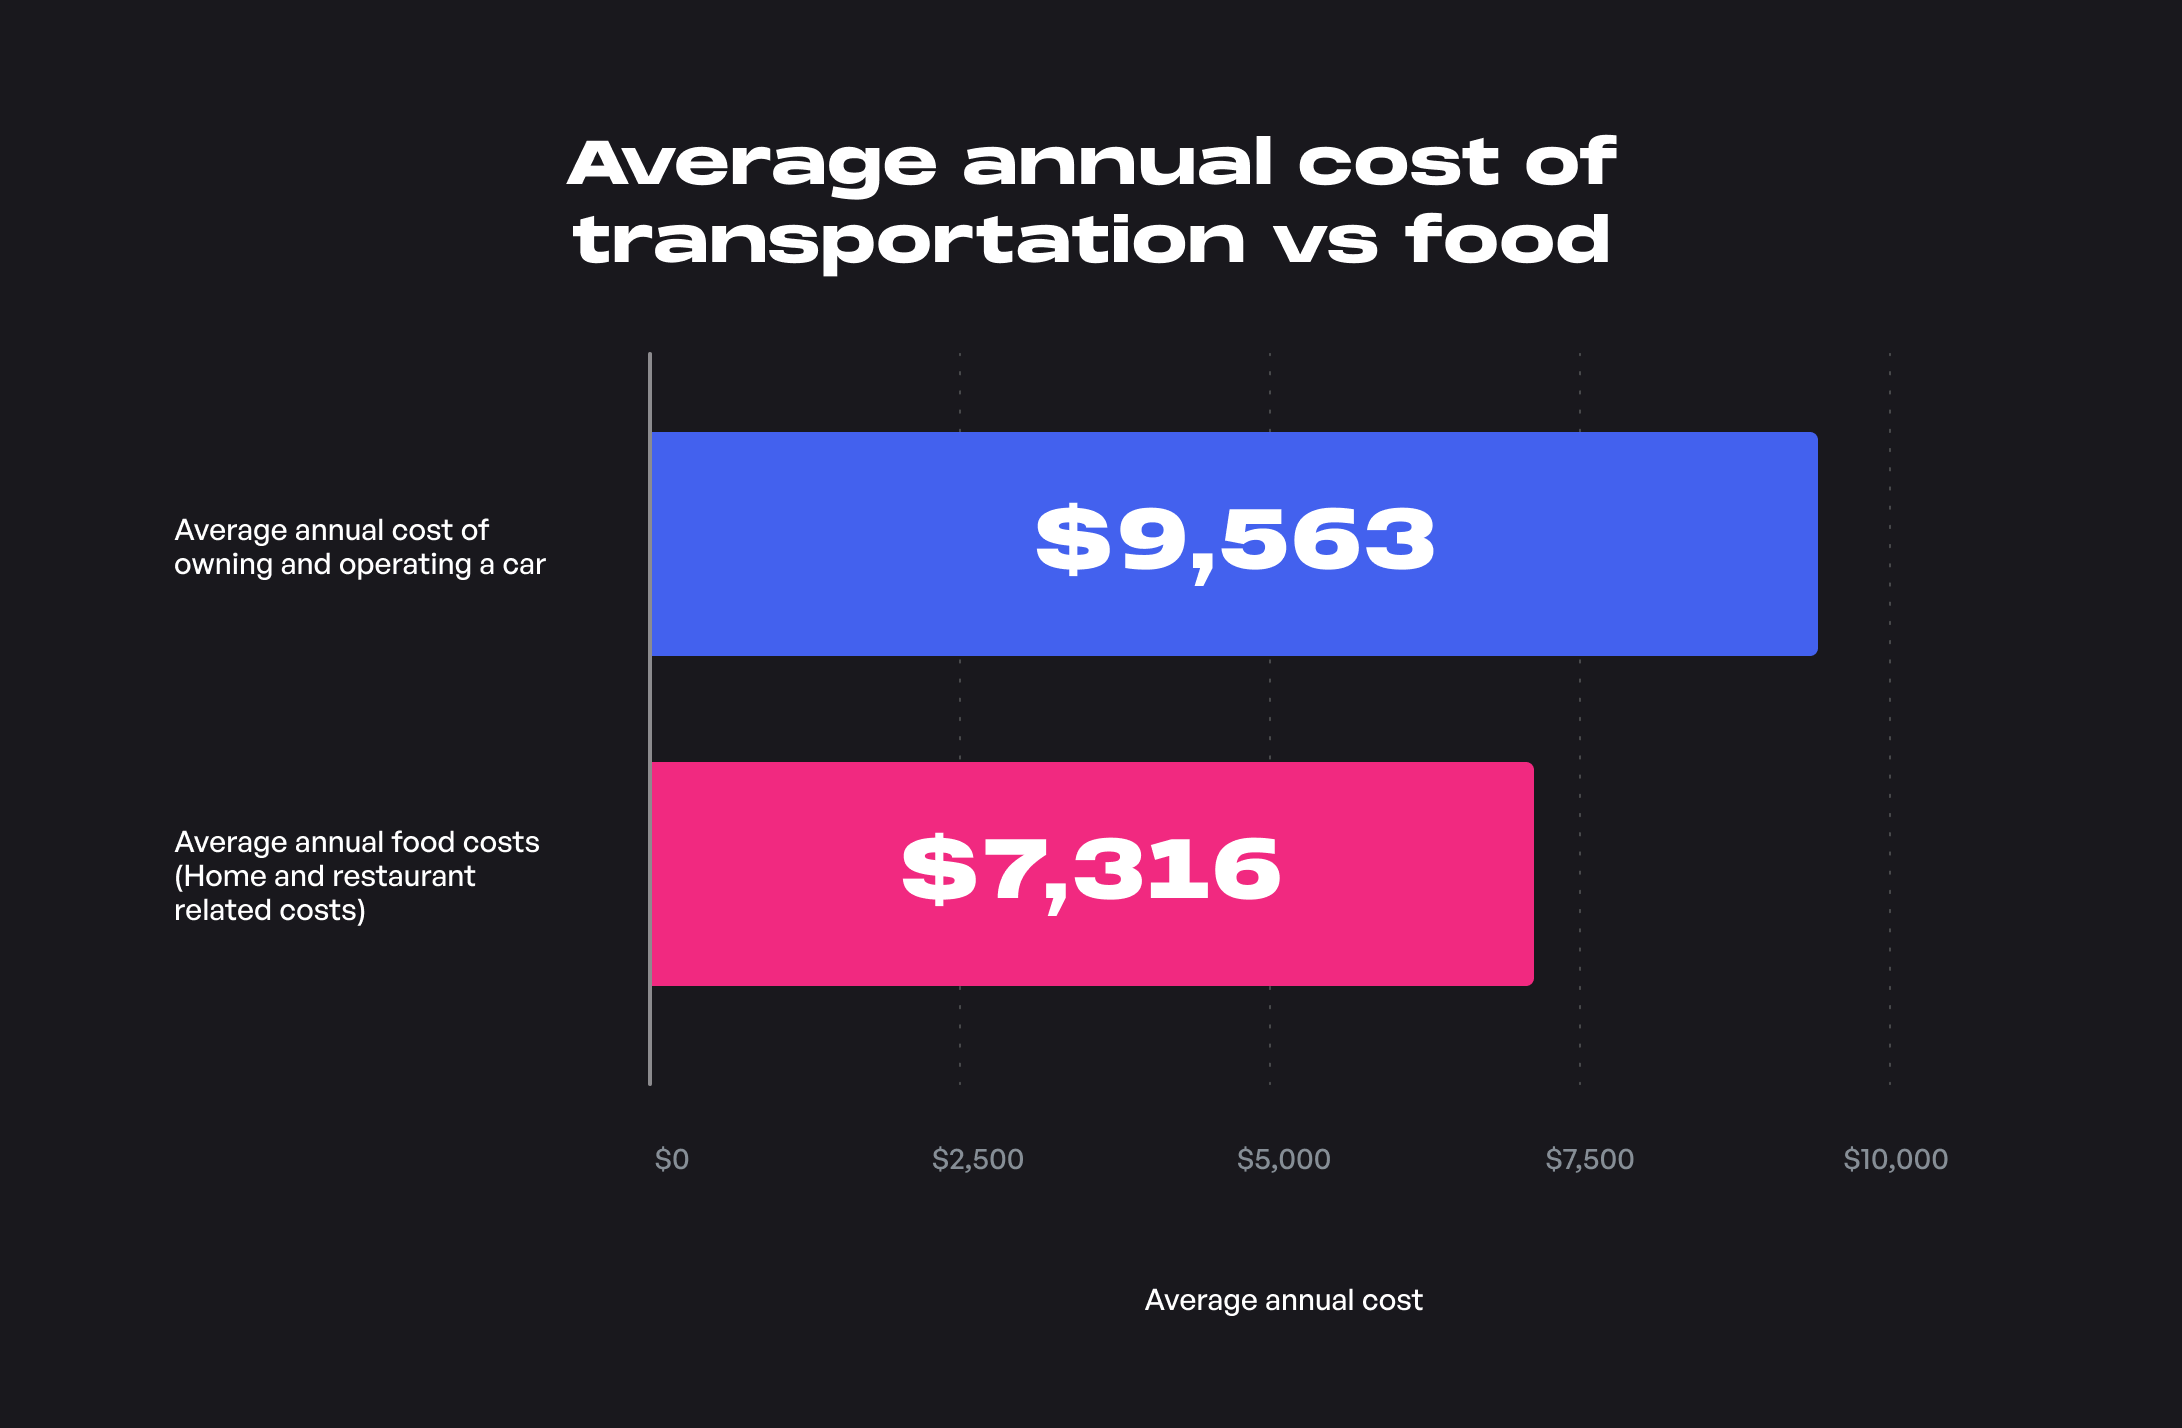
- Use public transportation: The cost of owning and operating a car (including fuel costs, insurance, and parking) for an average US household is $9,563 annually , which is 30% higher than the complete food budget of the household ($7,316 annually). Even if you don't want to travel completely by public transportation, you can save a lot of fuel and parking costs by traveling by public transport for shorter trips.
- Try carpooling: Carpooling can be practical if you have any co-workers that live close by so you can split the costs while traveling to and from the same location (in this case, the workplace). It can also be viable if any of your neighbors’ children go to the same school as your kids. Some workplaces sponsor ride-sharing programs for employees and even provide you with a company-owned vehicle. If you drive the average commute, which is 16 miles in the US (one-way), then just splitting the cost with another person can lead to savings of more than $600 a year ($50 a month).
- Get a remote job if possible: If you work in an industry where you are not required to show up in the office to get work done effectively, then consider applying for remote or hybrid (a combination of remote and in-office) roles. This could mean huge savings in terms of commute time as well as transportation costs.
- Take good care of your vehicles: Check your tires frequently, keep your tires full of air, get regular oil checks and take the time to get your vehicle a basic maintenance check regularly. This could help prevent major issues and expenses down the road as well as improve the resale value of your car if it is well maintained.
Taxes
After household expenditure, the next biggest expense for the average American is taxes. The average US household pays about $7,432 a year in personal taxes, not including property taxes or sales taxes. A huge part of this amount is in the form of Federal Income taxes. Tax accounts for 12% of a household’s yearly expenditure.
How you can optimize and save on tax
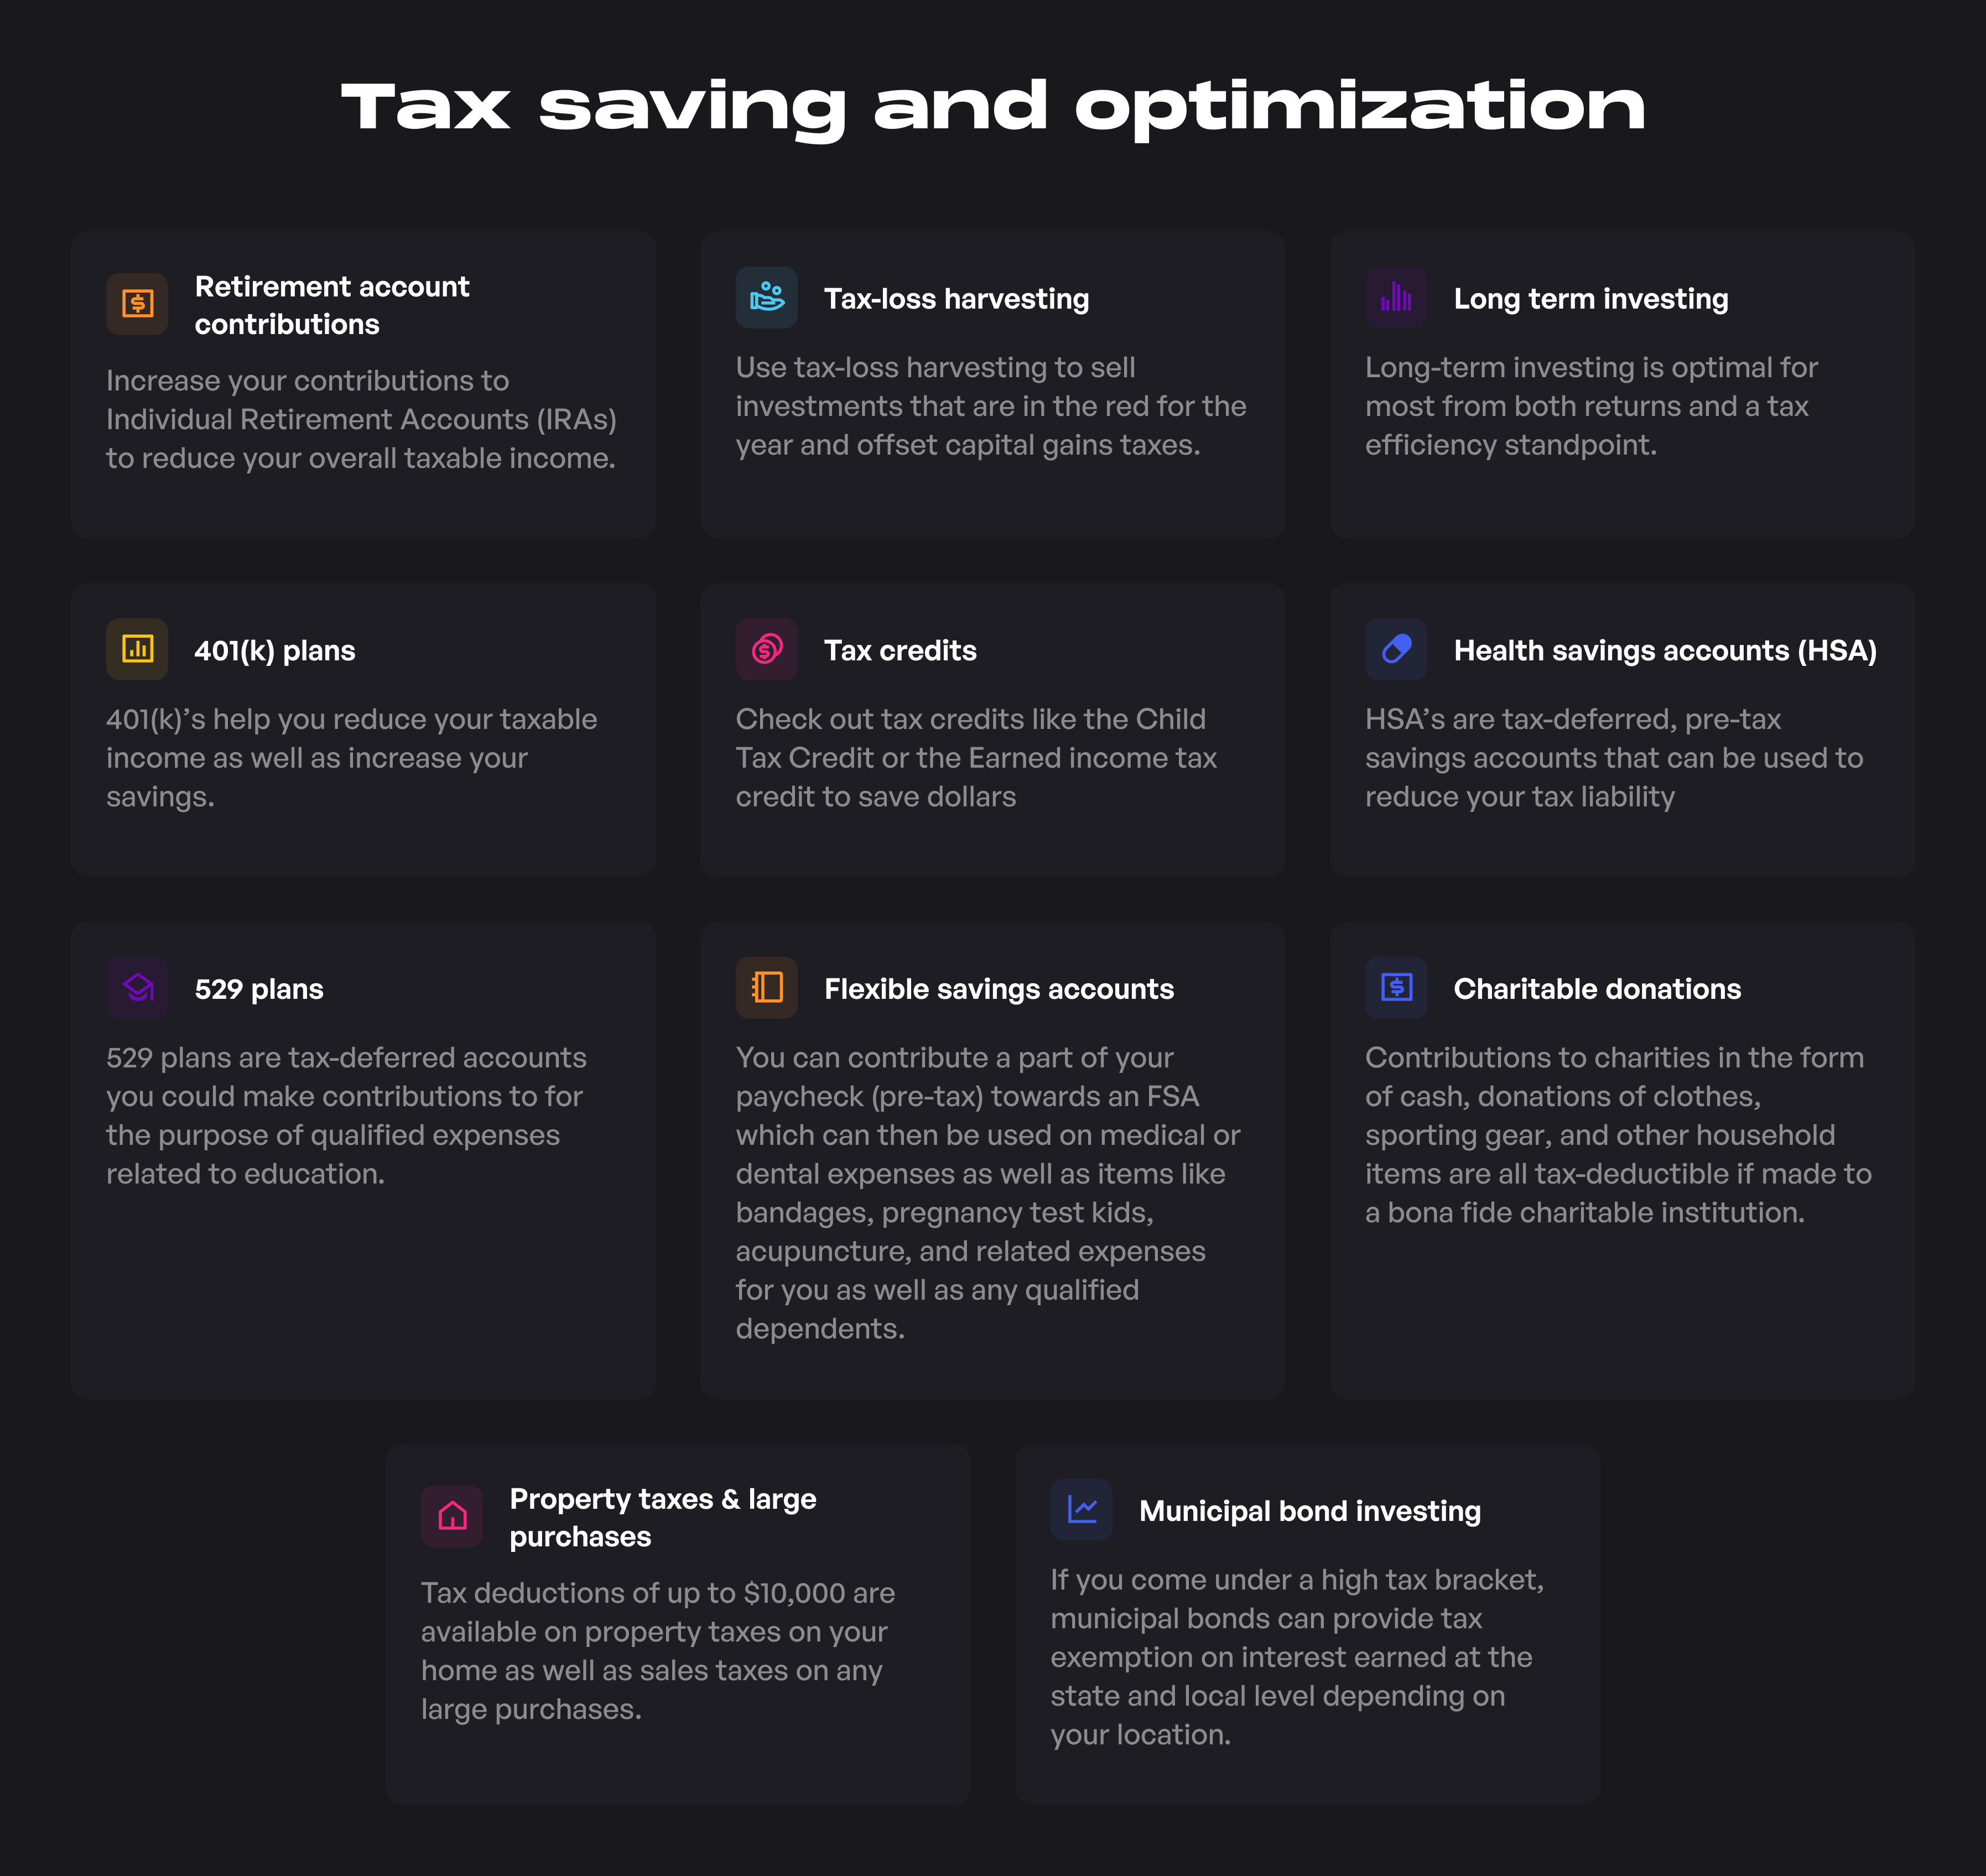
- Increase contributions to retirement accounts: By increasing your contributions to Individual Retirement Accounts (IRAs) you can reduce the income you are taxed on in the current financial year as well as save and invest money for your retirement.
- Tax-loss harvest your investments: You can use tax-loss harvesting to reduce your tax liabilities on your investments. If you have any investments that are down for the year, you can sell your stock, ETFs, or mutual fund units at a loss to offset capital gains taxes , thereby reducing your tax liability.
- Invest with a long time horizon: Investing for the long term has been proven to be the optimal investment strategy for the majority of individuals. Long-term investing not only outperforms most short-term strategies but is tax-efficient as well. If you as a long-term investor hold assets for more than a year, you taxed preferentially at a tax rate of 0%, 15%, or 20% on the capital gain, depending on the level of your income.
- Make use of employer 401(k) contributions: The standard 401(k)s are a great way to reduce your taxable income and thereby your taxes. If your employer matches your contributions, then it’s all the better!
- Utilize tax credits: Check out the different tax credits which are available to you as they can reduce your tax bill by quite a lot. Look out for the Child Tax Credit (deduction of $2000 for every qualifying child under the age of 17 ), Child and Dependent Care Tax Credit (up to $3000 for one child and up to $6000 for two or more children), or the earned income tax credit can be as much as $6,557 for a family with children or up to $529 for taxpayers who do not have a qualifying child which can be an option for modest-income households.
- Contribute to a health savings account (HSA): If you have a high-deductible health insurance plan you can use a health savings account (HSA) to reduce your tax liability. An HSA can help reduce your taxable income and serve as a buffer for planning future health-related costs. The HSA has a triple advantage. You can contribute to it pre-tax, the gains from it are tax-deferred and finally, you can withdraw it tax-free for any qualified medical expenses.
- Save for college education: If you are thinking about pursuing further education or are setting aside money for university for your kids, you could consider making contributions to a 529 college savings account. Here, you make your contributions post-tax but the gains are tax-deferred while invested.
- Fund your flexible savings account (FSA): If your employer offers you an FSA, then make sure you take it as you can contribute a part of your paycheck tax-free directly into your FSA. If an FSA is created through your employer, then every dollar you contribute to it lowers your overall taxable income. The maximum limit for 2021 is $2,750 and you have to use it within the current financial year on medical or dental expenses as well as items like bandages, pregnancy test kids, acupuncture, and related expenses for you as well as any qualified dependents.
- Donate to a qualifying charity of your choice: Any contributions made to charities are tax-deductible. This includes not only cash donations but donations of clothes, sporting gear, and other household items if they went to a bona fide charitable institution.
- Tax deductions on large purchases and property taxes: If you have the receipts for sales taxes on any large purchases as well as property taxes on your home, you can claim tax deductions of up to $10,000.
- Municipal bond investing for high-income individuals: Interest on Municipal Bonds where you lend money to a local state or government entity may be exempt at the state and local level based on your location. They generally offer lower interest rates but because of the benefits concerning taxation that they offer, they are attractive to individuals in the higher tax brackets.
Food
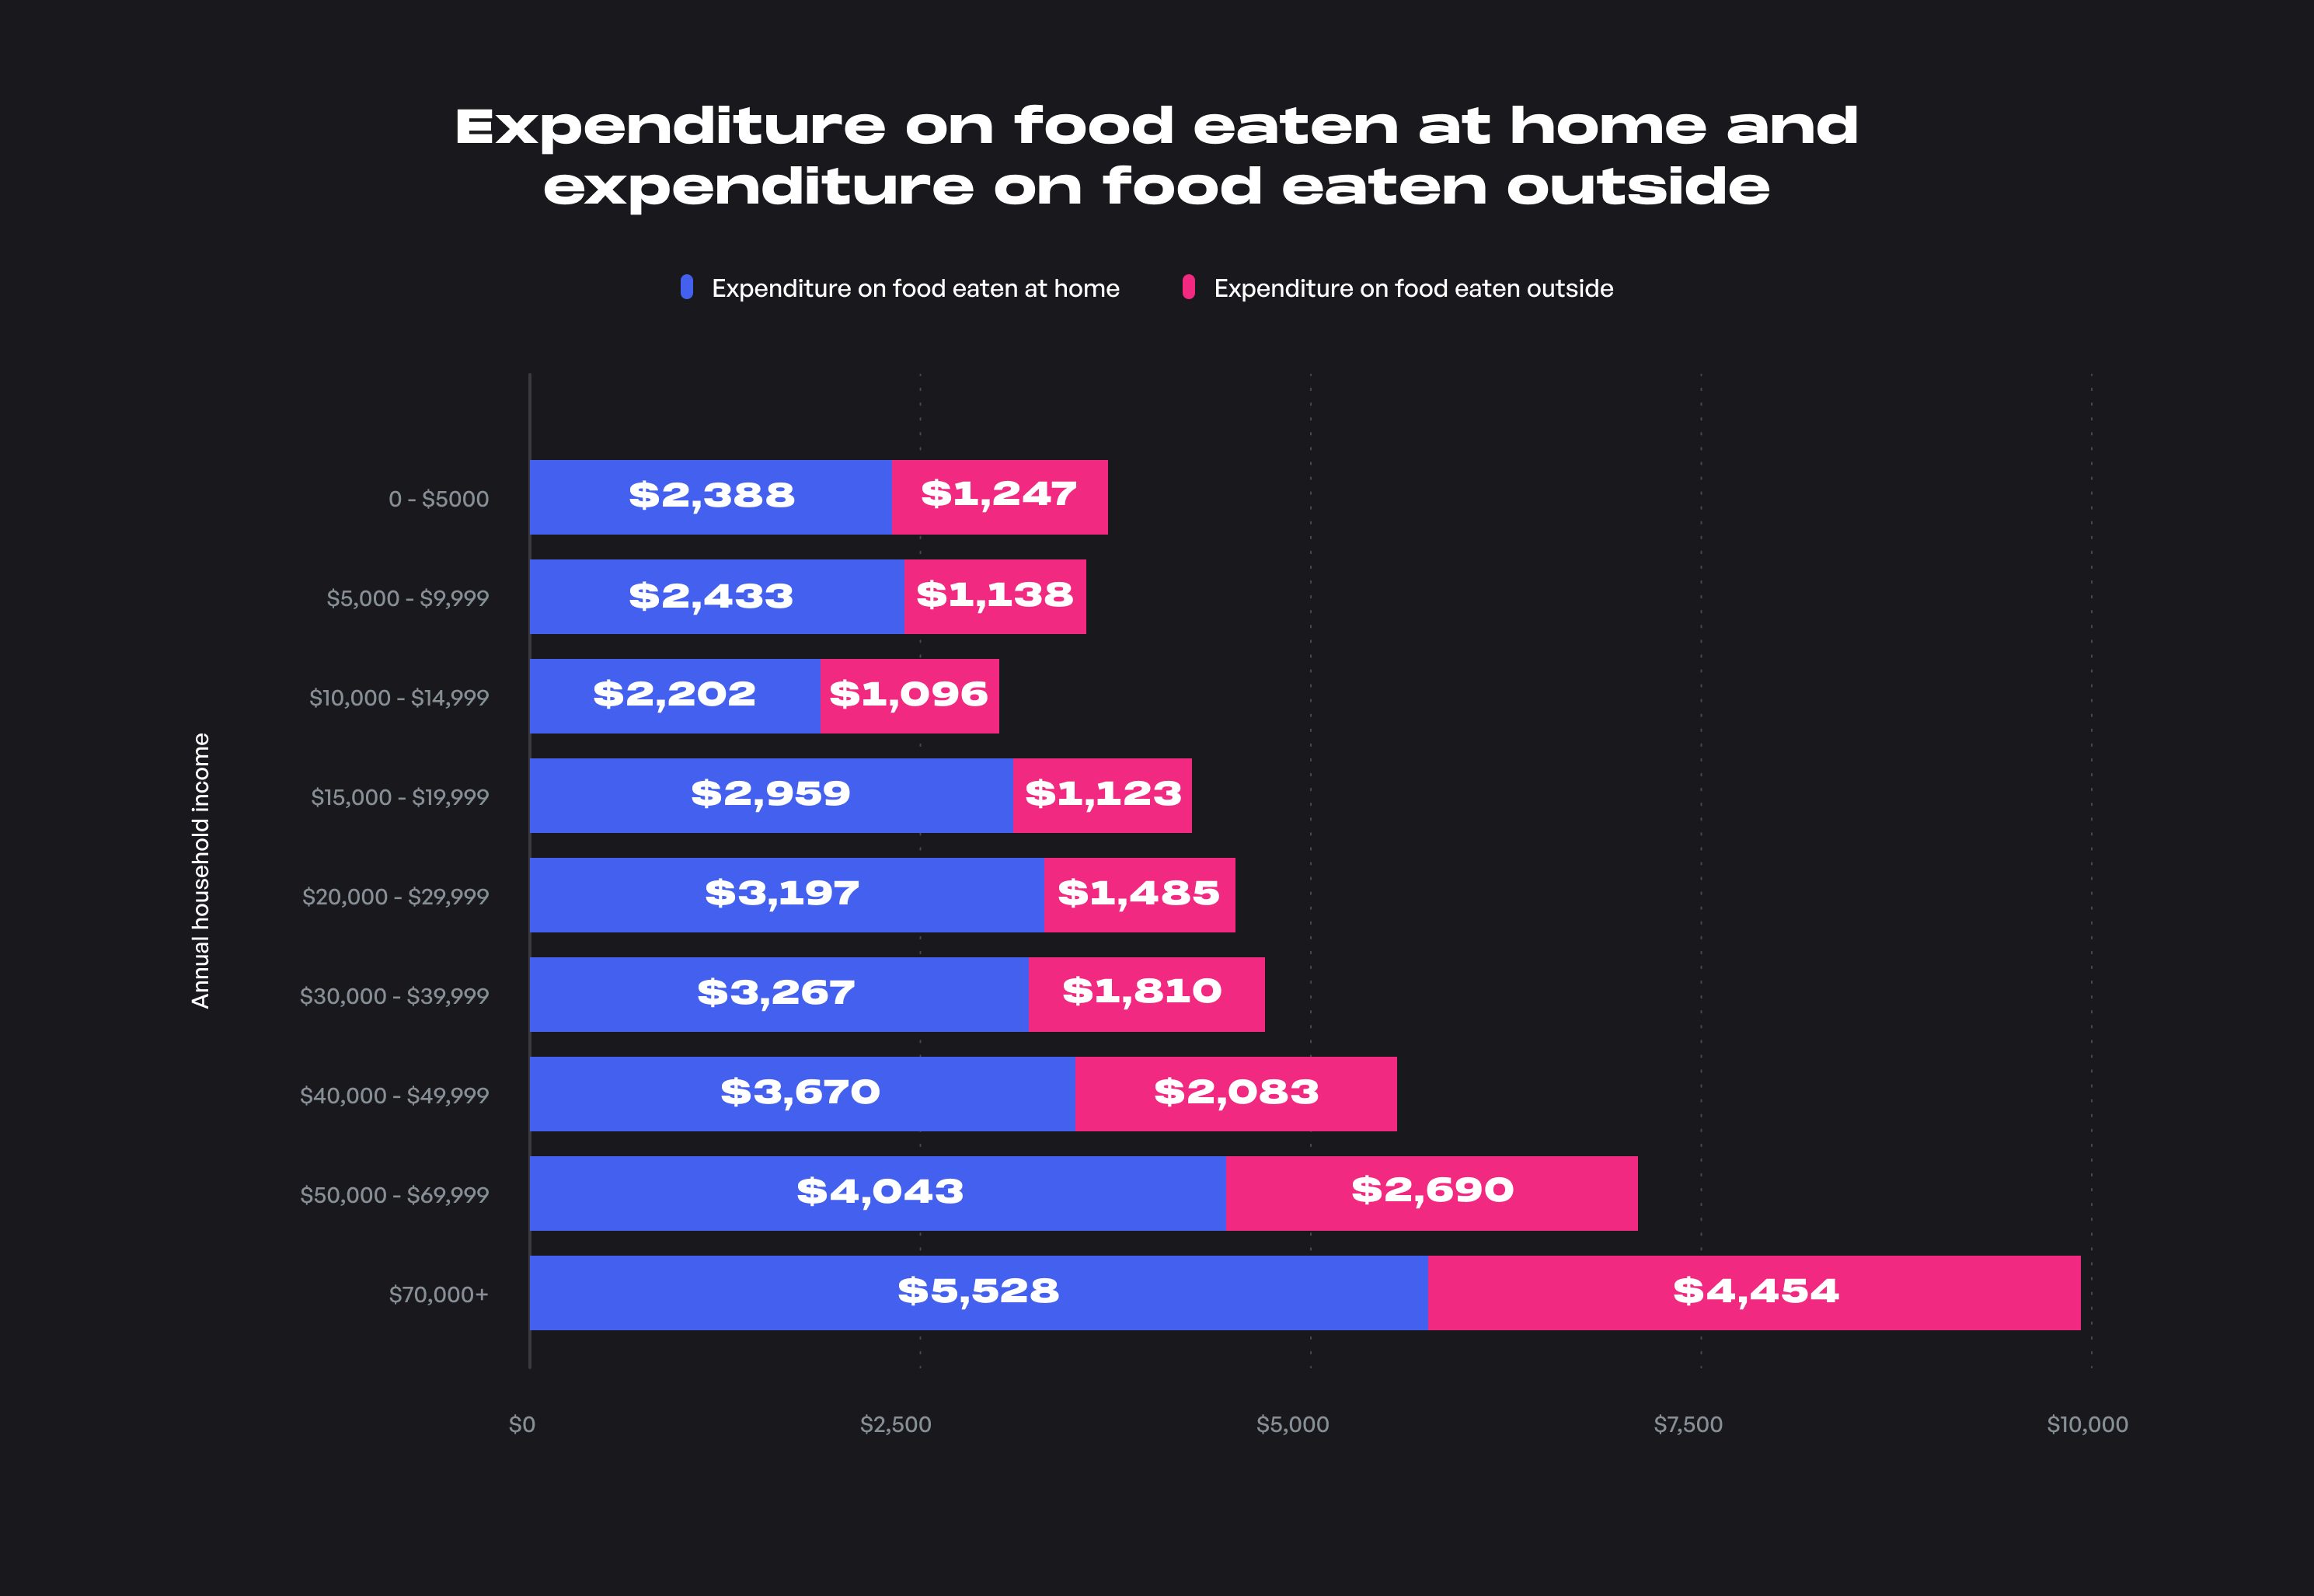
Almost 10% of the yearly income of the average American household gets spent on food. The average monthly expenditure on food is $610 per month ($7,316 per year). About 33% of that expenditure is spent on food consumed outside our homes such as at restaurants, fast food joints, and when we’re traveling/on vacation. The remaining 67% is spent on food eaten at home.
However, these percentages fluctuate a lot based on incomes and higher-income households (>$70,000/year) spend almost 3 times on food when compared to the lowest-income households (<$15,000/year). The higher-income households also eat out more often (45% of the time) than lower-income households (~33% of the time).
However, based on 2020 data, expenditures on food away from home declined for all income groups. Declines in food away from home expenditures ranged from 27.8 percent for the second income quintile to 37.9 percent for the lowest income quintile.
How you can optimize your food budget

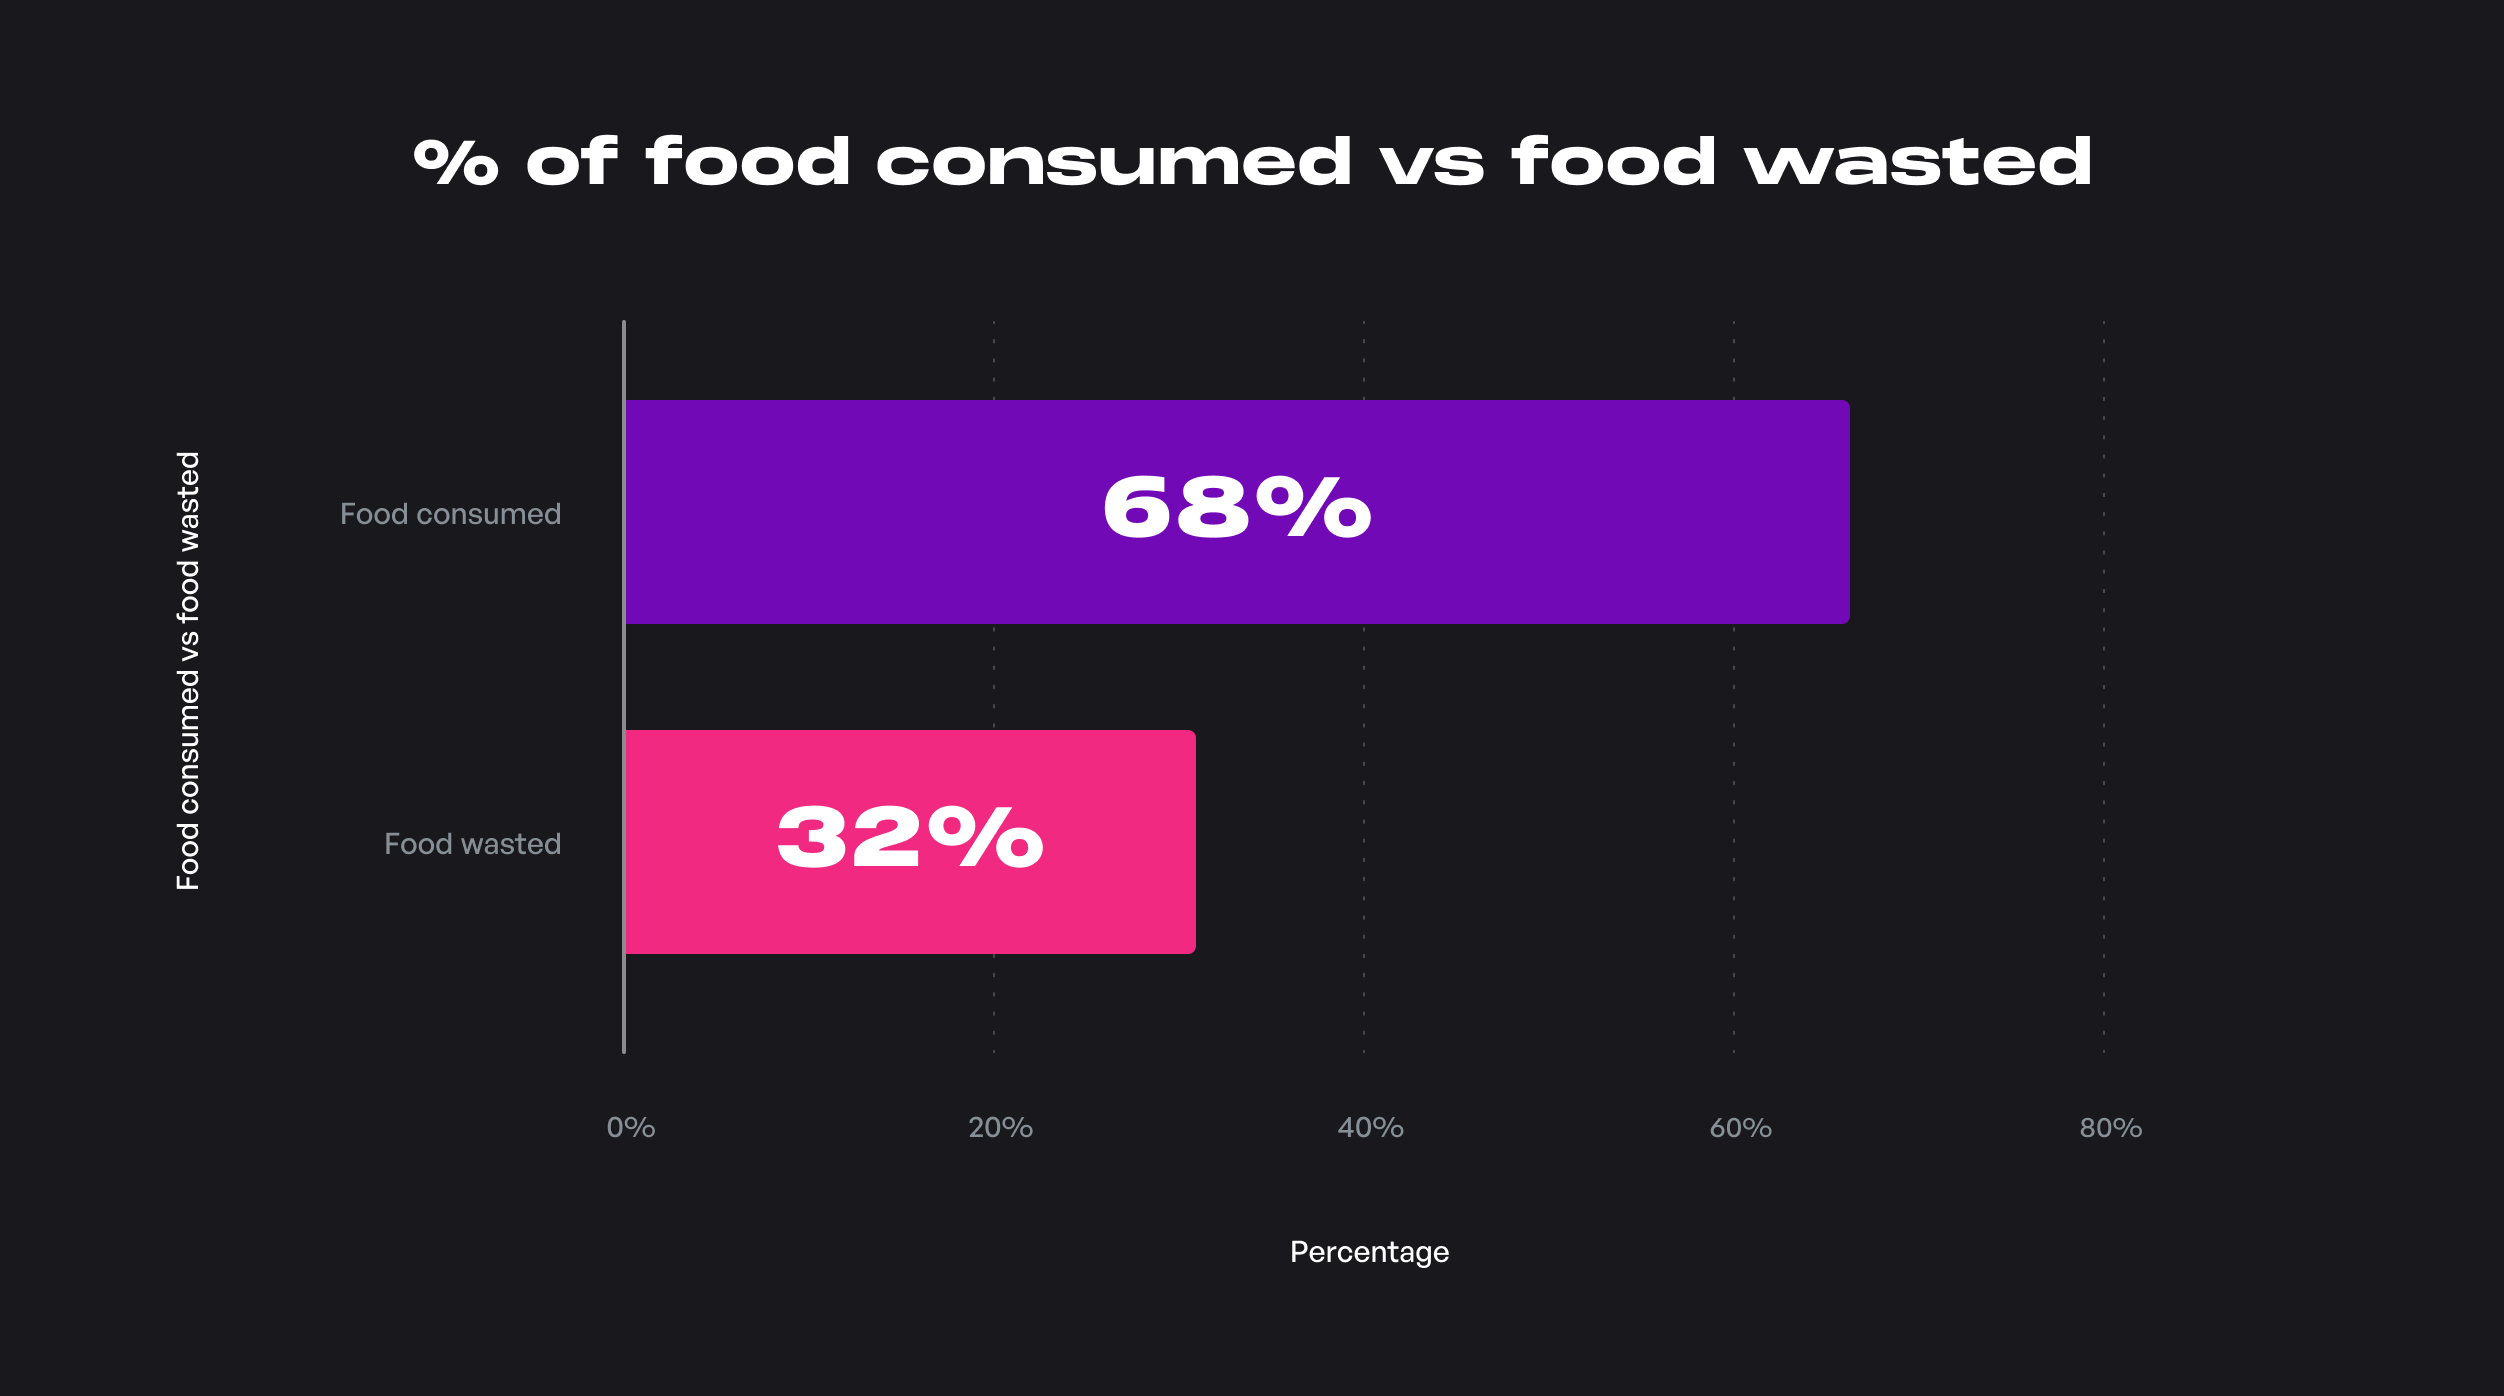
- Observe your consumption and buy groceries appropriately: The average US Household wastes about 32% of food that they obtain. Take a week or two to observe how much food you’re consuming on a week-on-week basis. Then you’ll be able to tailor your shopping list with the quantity necessary for your needs.
- Know what you're spending on: Try to create a simple system for monitoring your food costs. This can be as simple as creating a basic spreadsheet and jotting down all food-related costs (both home food as well as eating out) to using specific software to analyze your spending patterns. Doing this can help you identify the items on which you're spending the most and will help you discover unnecessary and hidden expenses.
- Taste before buying when possible: If you’re looking to try something new or exotic that you haven't tried before, or even food products from a new brand, do try out a free sample first if it’s available. We all have had the experience of buying some new food product, tasting it once, and then not touching it again! Another alternative is to buy smaller portion sizes (smaller quantities) so that not much goes to waste if you don't like it.
- Buying in bulk/wholesale: Take a glance at what you buy most regularly and have to replenish quickly and buy them in bulk when and where possible so that you can reduce your unit price. The foods you can do this with are non-perishables as well as items that are consumed quickly like milk, grains, eggs, ketchup, peanut butter, and jams.
- Save and get creative with leftovers: Food waste is a massive problem. Globally, we waste about 1.4 billion tons of food every year. Small portions of leftovers can be eaten as snacks and can also be repurposed into different meals wherever possible. This can help you save the planet and save on expenses as well. Double whammy!
- Store produce in the appropriate conditions: Every food product has its associated storage instructions that can help extend its shelf life. For example, certain fruits and vegetables shouldn't be refrigerated or kept with each other as doing so could reduce their shelf life.
- Use credit cards that reward grocery/restaurant spending: If you can use them appropriately, use credit cards that offer rewards and/or cashback for shopping at grocery stores or buying meals at bars and restaurants.
- Split entrées and skip the extras: When dealing with large portion sizes at restaurants, split the entrée so that you don't have to eat even after you're full or let food go to waste. Also, when possible, skip the extras like desserts, drinks, and other appetizers.
- Buy discounted gift cards: Most large restaurant chains have loyalty gift cards that reward repeat customers. If you have a chain that you visit often, check online or in-person to see if they have any gift cards that you can take advantage of.
Social security contributions, personal insurance, and pensions
The typical US Household has an expenditure of about $7,246 annually (~$603/month) to safeguard its dependents from poverty in old age or unfortunate circumstances like disability and death.
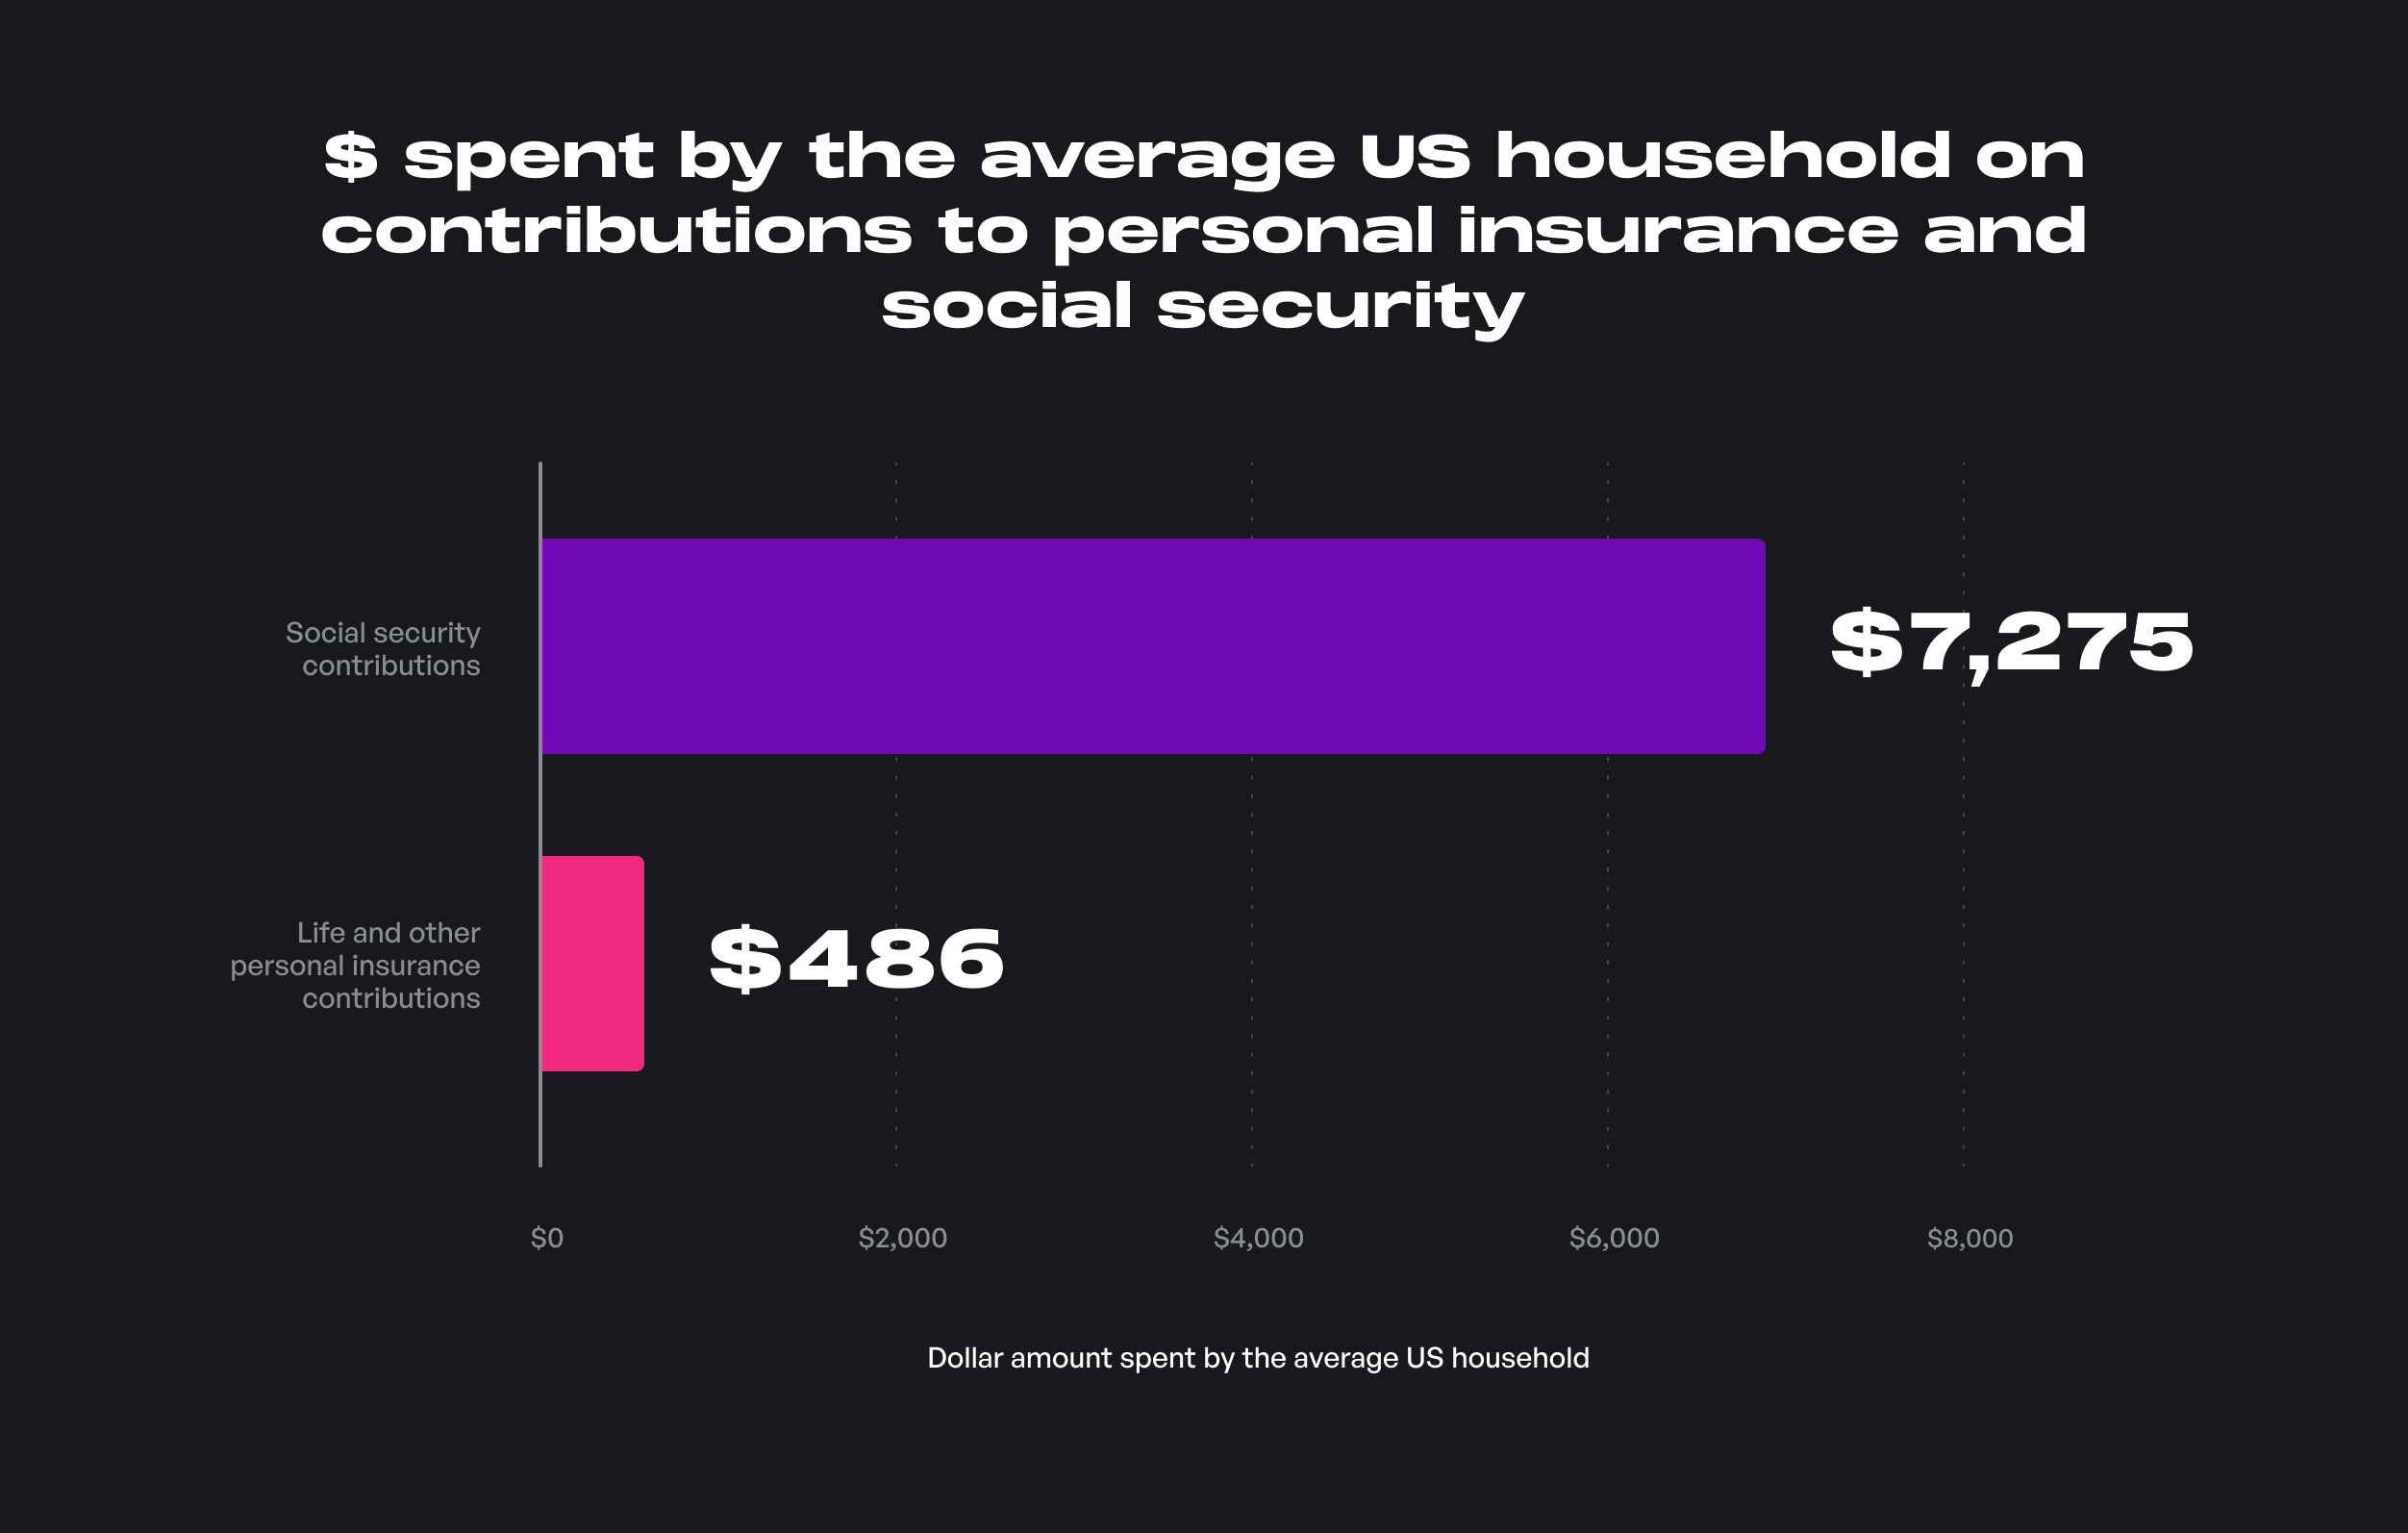
The major expense in this category, which is paid by 77% of households, goes towards social security contributions. The average amount paid towards social security is $7,275, which may cover one or more workers.
Also, a little more than 25% of US households have either life insurance or other personal insurance , at an average cost of about $486 annually (~$41/month). As social security is a huge part of overall spending in this category, that is what we’ll be focusing on.
How you can optimize your social security contributions

- Don’t claim benefits too early: It is impossible to estimate how long we will live after retirement. But one factor that you have in your control is when you claim your benefits. Waiting longer to claim your benefits will give you the maximum possible amount. By delaying the start of your benefits after you retire, you’ll receive an 8% “raise” in benefits for every year you defer from taking benefits. If you claim benefits at 62, you'll receive about 30% less than if you had waited until your Full Retirement Age (FRA), which is now fixed at 67 if you were born after the year 1960. Finally, If you claim benefits at full retirement age or older, there is no limit on the amount you can earn by working in retirement.
- Work at minimum a full 35 years: The way the Social Security benefit is calculated is by tallying the amount of tax you paid each year to the Social Security Administration (SSA) in the 35 years where you earned the most. So, if you haven't worked for 35 years or more, then your benefits will be lower. Once you have completed 35 years of earnings, each new year of higher earnings will replace the years with lower earnings thereby increasing your benefits.
- Claim spousal benefits: If you are eligible, spousal benefits can increase your monthly check by $700-$800. In the meantime, you can also delay your benefits and let them keep growing. According to the Social Security Administration, the spousal benefit can go as high as 50% of the working spouse’s primary insurance amount.
Debt payments and savings
About 8% of the annual budget of the average US household goes towards paying off debt and increasing savings and sometimes a combination of both when it comes down to mortgage payments. The goal in this particular category of expenditure would be to pay off debt as soon as possible (starting with high-interest debt), increase the savings component and make advanced mortgage payments to reduce interest payments.
How you can optimize and pay off debt faster

- Understand minimum payments: Generally, most forms of debt demand that you make a minimum payment, based on certain factors which are set by the lender. If you skip a minimum payment, it may lead to fines, penalties, or hikes in interests rates.
- Pay off high-interest - rate debts first: This is also known as the debt avalanche strategy wherein you pay the minimums of all your debts but prioritize the rest of your payment towards those loans which have the highest interest rates. One of the prime candidates for this strategy is credit card debt which can be paid off first.
- Use the debt consolidation strategy: This strategy involves combining multiple old debts and rolling them into a new one, if possible at a lower interest rate. Following this strategy can help you manage your monthly payments better or at lower interest rates.
- Try building an emergency fund concurrently: This might sound a bit counter-intuitive when you’re trying to pay off debt, but building an emergency fund and contributing to it while optimizing expenses in the areas discussed above can keep you from creating more debt, especially in times of emergencies.
- Develop a strict budget to track income and expenses: Having a budget mapped out can help you be observant of your income and spending and help guide your attention towards reducing unnecessary costs. This can help you improve your savings rate which you can then use to put forward advance payments on debt and mortgage loans.
- Leverage your personal assets for lower interest rates: If you own a home, a car, or any other property, you may be eligible you could leverage your equity in these assets for debt consolidation. Thus, you may be eligible for reductions in interest rates on your debts.
- Reach out to Credit counseling agencies: These are organizations, usually non-profit, that you can utilize to help you manage your debt and finances. In this case, certified credit counselors negotiate with lenders and creditors on your behalf and build up a personalized and affordable debt management plan. The way it works is that you send a lump-sum payment every month to the Credit Counseling Agency and they allocate the payments efficiently towards your creditors, on behalf of you. If you're looking for a Credit Counseling Agency, you can take a look at the National Foundation for Credit Counseling or the Financial Counseling Association of America.
- Prioritize improving your credit score: Stick to the best practices when it comes to using your credit cards such as lowering your credit card utilization rate, paying off small balances, and so on which in turn helps in improving your credit score.
Healthcare
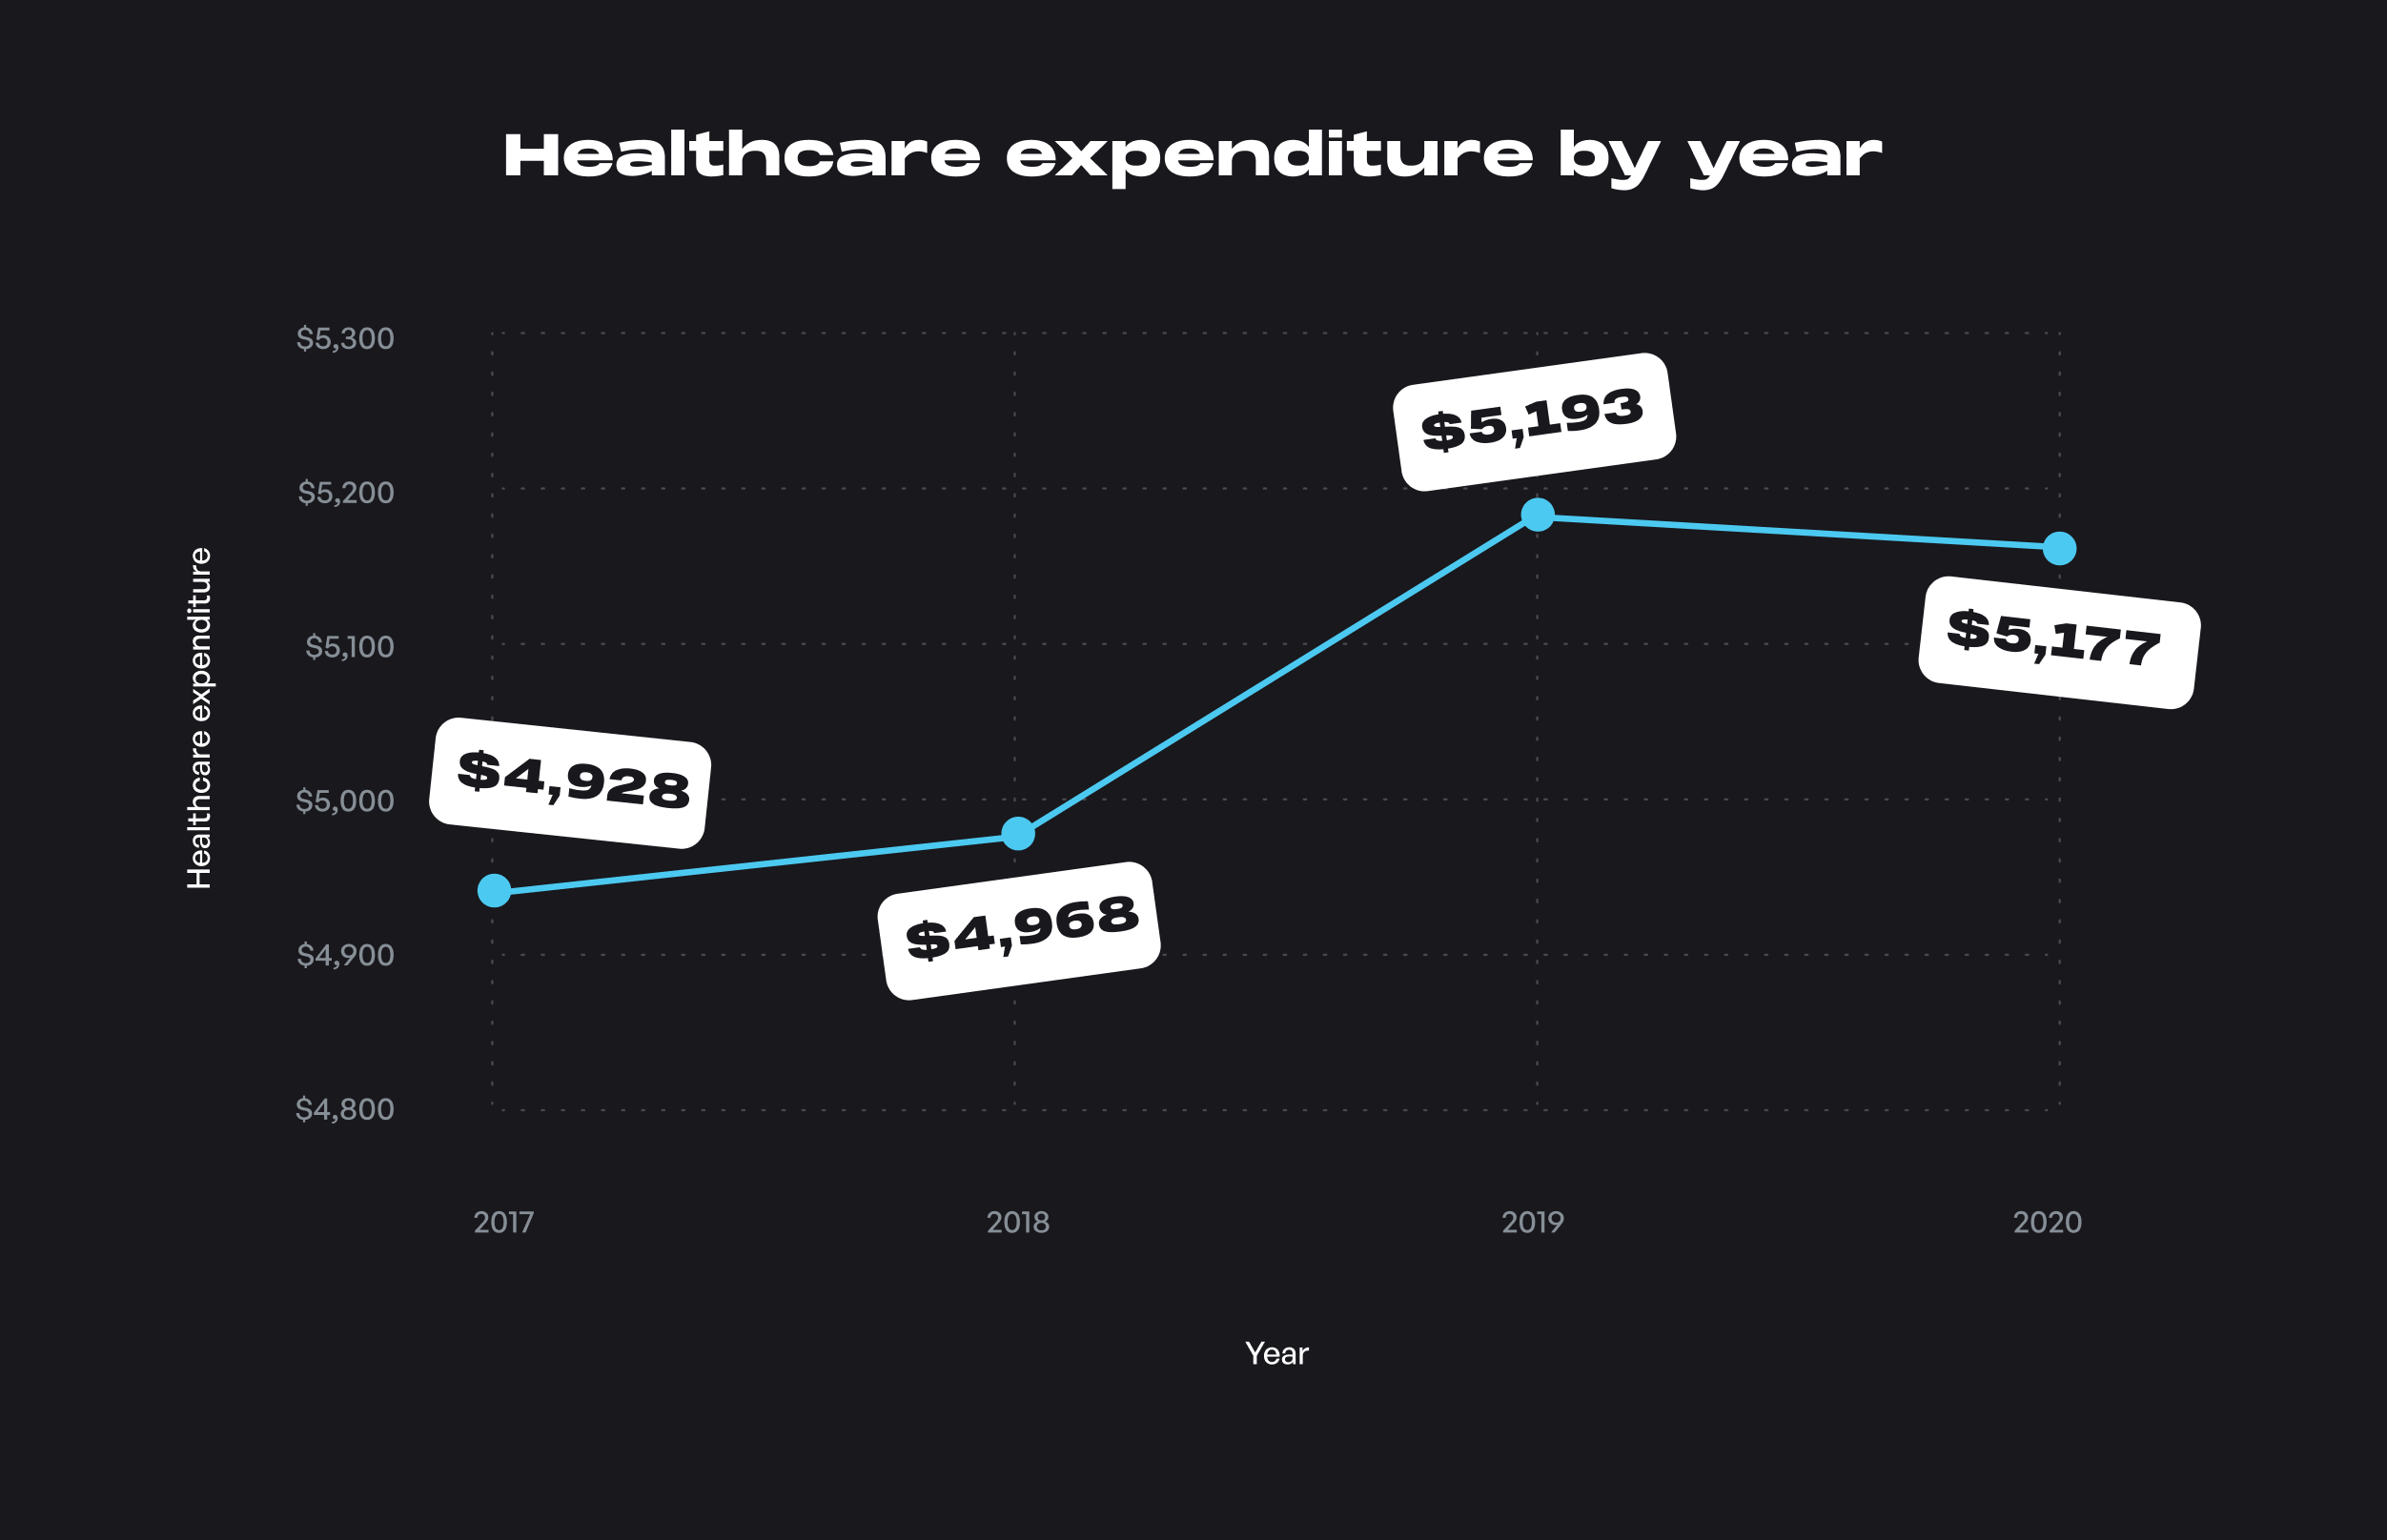
While expenditure as a percentage of the overall budget has reduced in areas such as apparel, fashion, and personal care due to the rise of cheap fashion, cheaper clothing, and personal products, healthcare costs in the US have been on the rise. The average US household spends about $5,177 annually on healthcare.
Also, healthcare costs have risen from 6% of the household budget in 2013 (the most recent year for which this data is available from the federal Consumer Expenditure Survey) to almost 8.5% in 2020 based on the Bureau of Labor Statistics.
In 2013, about 79% of households had healthcare expenses and an average of $4,365 was paid out by them in the year 2013, including health insurance premiums and out-of-pocket costs for doctors, prescriptions, and medical supplies.
The Affordable Care Act says that health insurance is affordable if premiums cost no more than 9.5% of a household’s modified adjusted gross income. When premiums exceed that level, individuals and families start to become eligible for subsidies if they purchase insurance on the federal or a state health insurance exchange.
How you can optimize healthcare-related costs
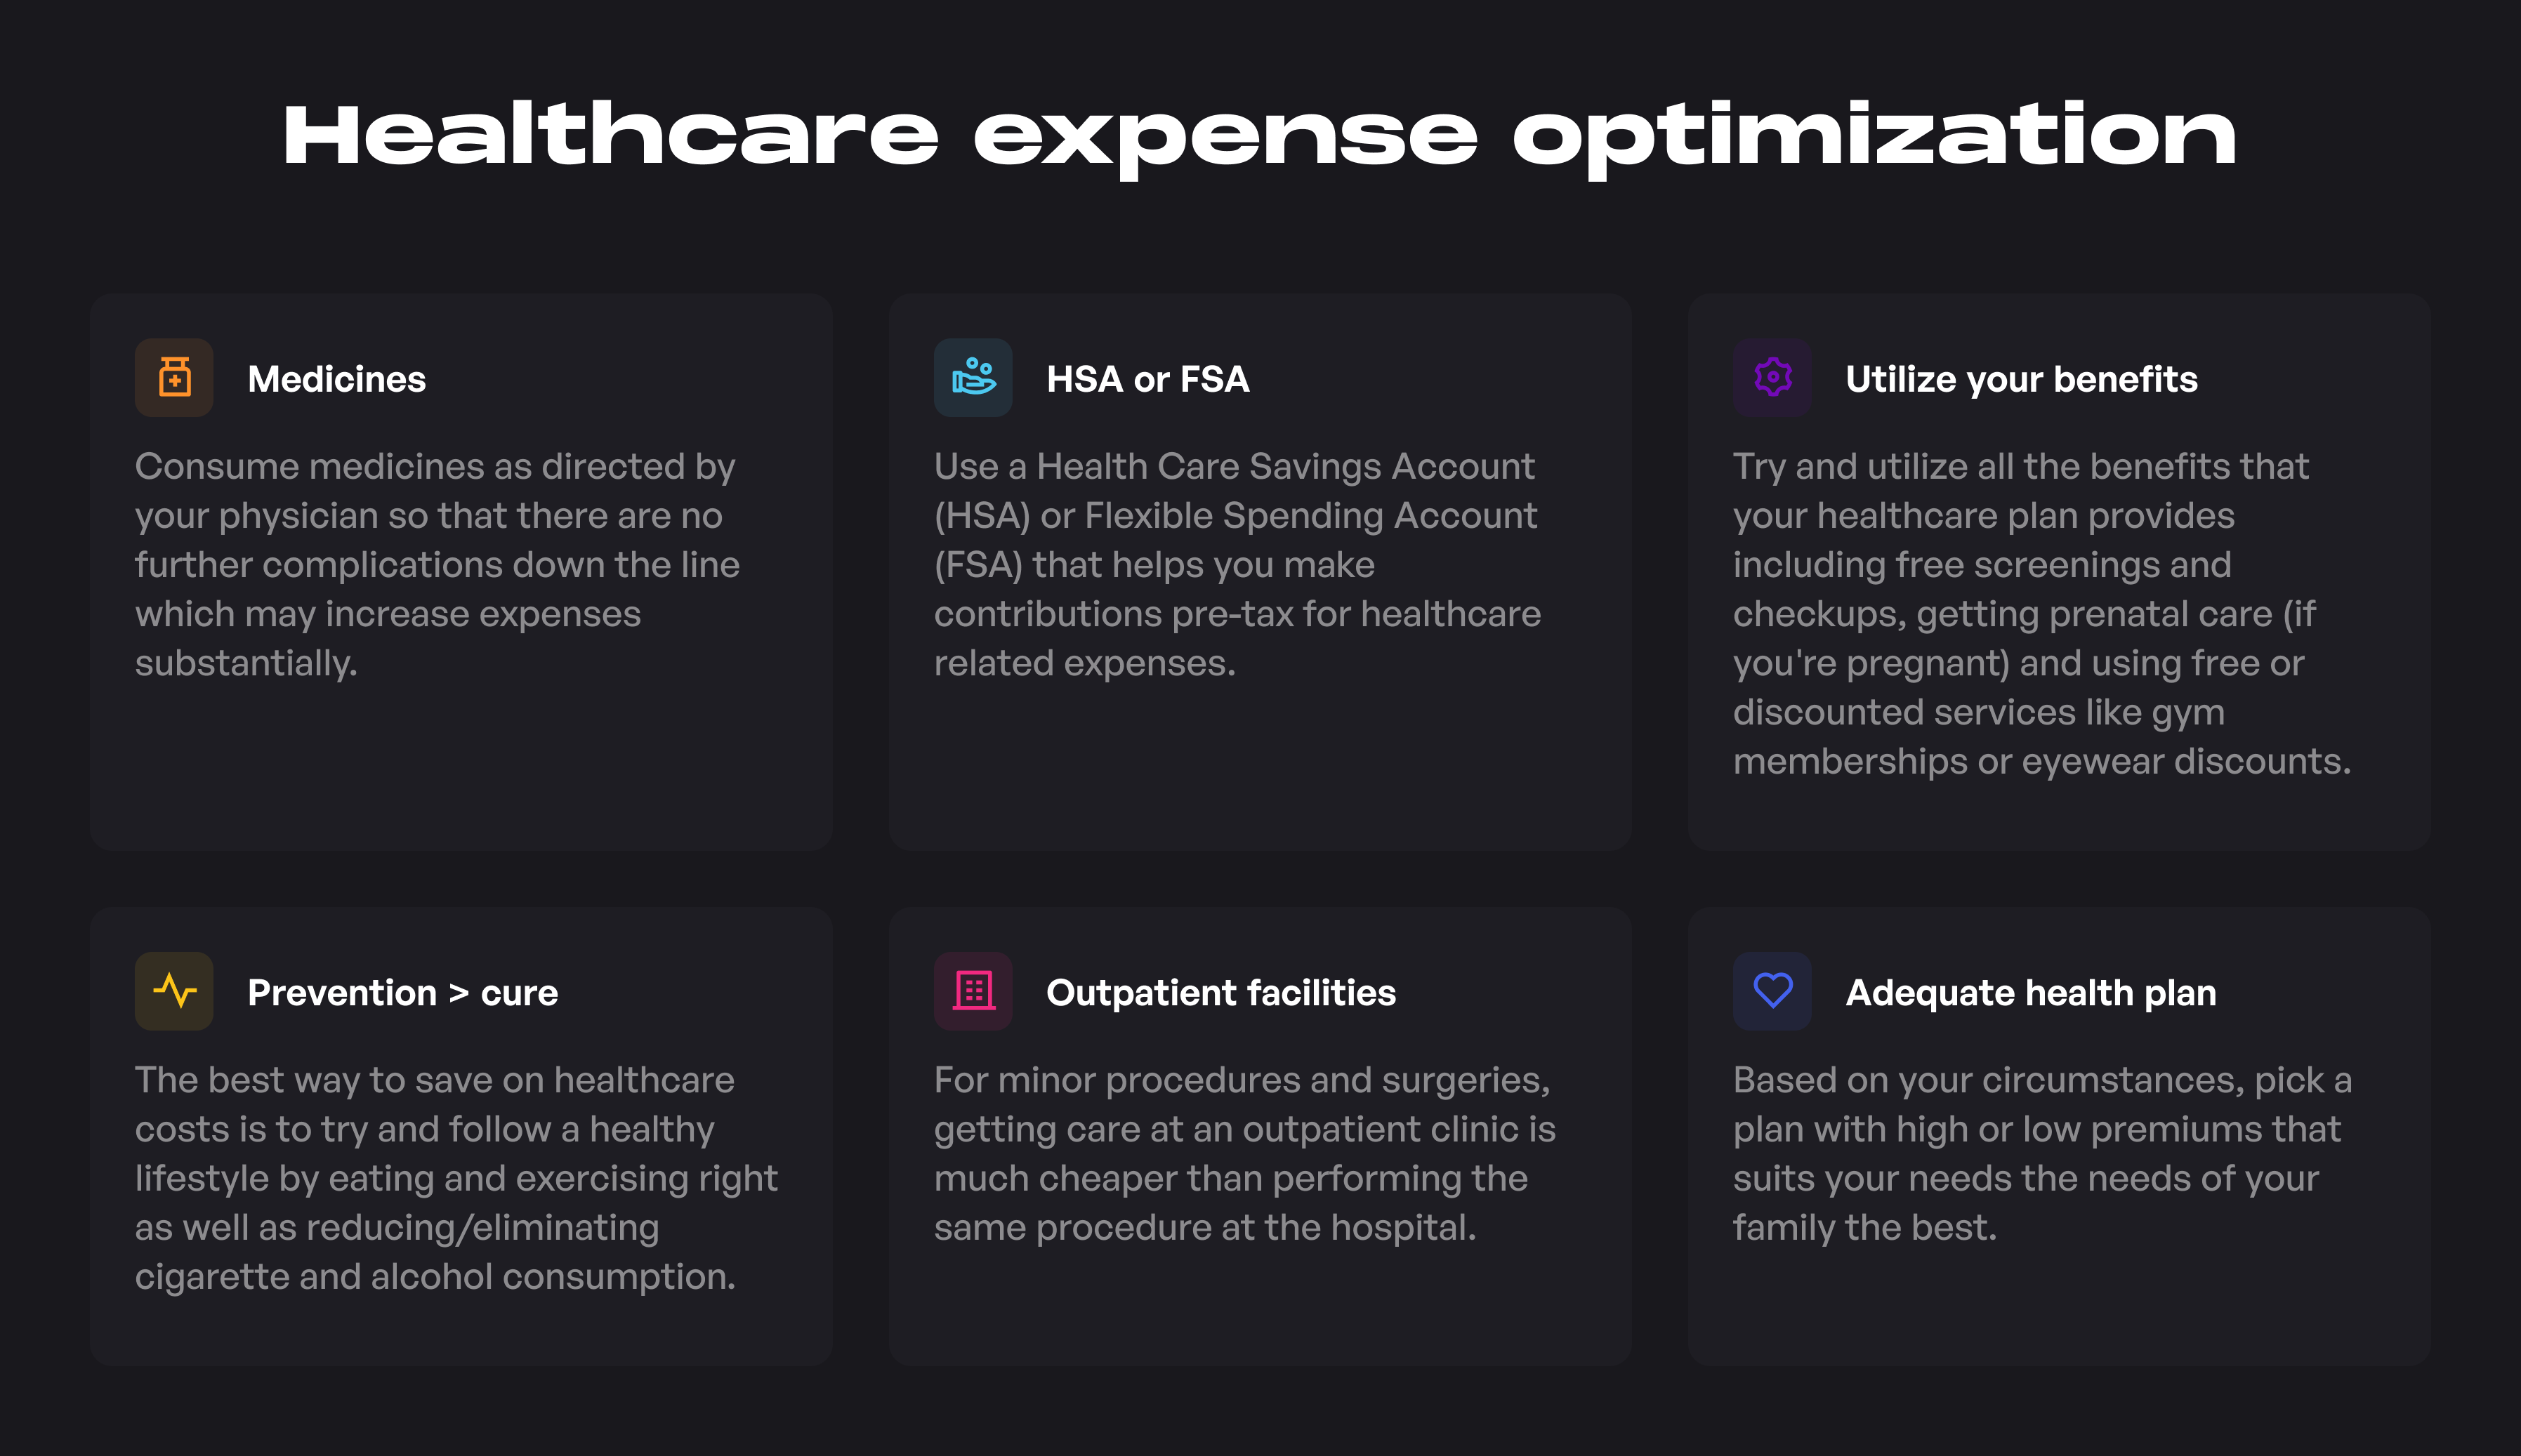
- Save money spent on medicines: There are several ways in which you can save money spent on purchasing medicines. The simplest thing you can do is to consume your medicines as directed by your physician. Skipping your meds or taking medicines in incorrect doses could lead to further health problems down the line which results in increased expenses. Another way to save on medicines is to ask your health provider if you can switch to generic medicines which have the same active ingredient but cost less than brand-name drugs.
- Use an HSA or FSA: Many employers offer a Health Care Savings Account (HSA) or Flexible Spending Account (FSA). These accounts are a form of savings account that helps you make contributions pre-tax for healthcare-related expenses. HSAs are owned by you, earn interest, and can be transferred to a new employer. FSAs are owned by your employer, do not earn interest, and their benefits must be used within the calendar year or they are void.
- Utilize your benefits: Try and utilize all the benefits your health plan provides. This can include getting health screenings (which are sometimes included for free in plans) to identify health issues and diseases in the earliest stages, getting prenatal care (if you're pregnant) for the safety and health of yourself and your baby, and finally utilizing free or discounted services like gym memberships or eyewear discounts.
- Take care of your health: Prevention is always better. Following a solid diet, quitting smoking/smoking less, and exercising regularly can help you avoid life-threatening diseases and the associated healthcare costs that come along with it.
- Request for outpatient facilities when possible: Getting care at an outpatient clinic is in many cases much cheaper than having the same procedure in a hospital. So if you need a minor procedure/surgery, ask your provider if you can have it done at an outpatient clinic.
- Choose a health plan that suits your needs the best: Pick a plan that best suits your needs as well as the needs of your family. If you have existing health issues, picking a plan with higher premiums lets you get more of your healthcare costs covered. If you rarely have any health issues, then you can save money overall by paying lower premiums.
Key takeaways
Finally, when it comes to reducing and optimizing your expenditure, it comes down to a few basic steps.
Understanding how much income you're making from all sources including dividends from investment, rent payment inflows, etc.
Calculating what percentage of your overall income is spent every month and what your major areas of spending are. You can then sort this list of expense categories into a small table based on descending order of dollar amounts spent on different categories.
Start from the category where you’re spending the most of your income and look for ways in which you can reduce spending. Then you can move down the list of different categories in reducing order of priority.
Optimize your spending in each category and use the extra savings to pay off high-interest debt, an advance mortgage payment, and invest the rest!
Why raise any money?
Josh Pigford
Ask the Advisor: Invest more or pay off debt?
Travis Woods
11 bold ways to boost your financial health
Josh Pigford
Join the Maybe  waitlist
Join the waitlist to get notified when a hosted version of the app is available.